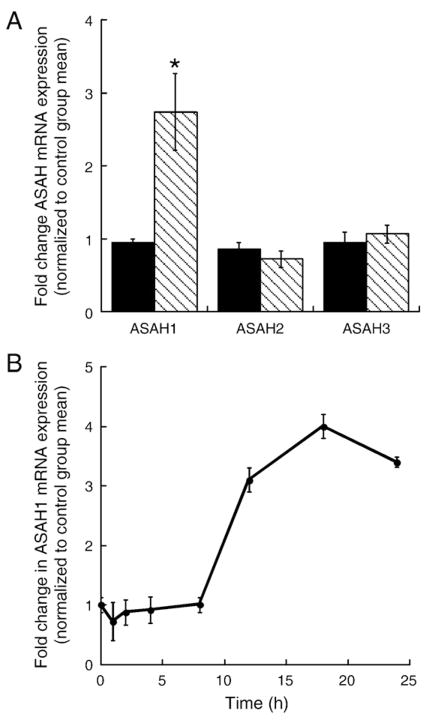
Fig. 1.
Bt2cAMP increases ASAH1 mRNA expression. (A) H295R cells were cultured onto 12-well plates and treated for 24 h with 0.4 mM Bt2cAMP. Total RNA was isolated for analysis of ASAH1, ASAH2, or ASAH3, and β-actin mRNA expression by qRT-PCR. Data is graphed as fold change in ASAH mRNA expression and normalized to the mRNA expression of β-actin. Data graphed represent the mean±SEM of three separate experiments, each performed in triplicate. Statistically different from untreated control group, p<0.05. (B) H285R cells were treated for 1 to 24 h with 0.4 mM Bt2cAMP and ASAH1 and β-actin mRNA expression quantified by real time RT-PCR. Data is graphed as fold change in ASAH1 mRNA content and is normalized to the mRNA expression of β-actin. Data graphed represent the mean±SEM of three separate experiments each performed in triplicate. Statistically different from untreated control group, p<0.05.

