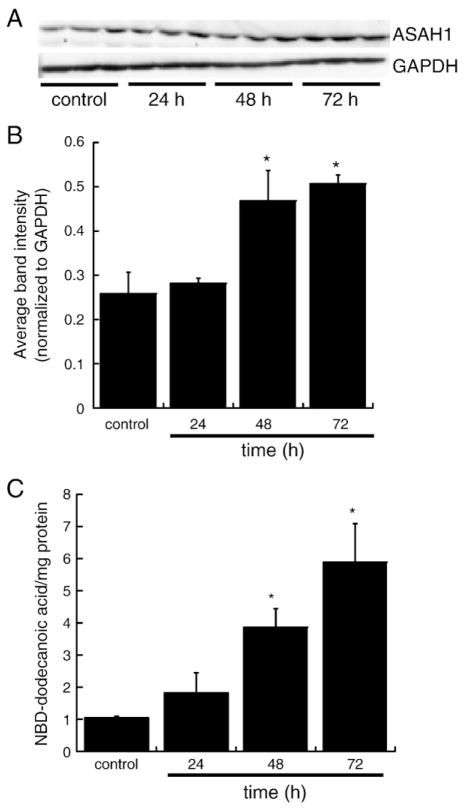
Fig. 7.
Bt2cAMP increases ASAH1 protein expression and enzymatic activity. (A) Representative western blot of H295R cells treated for 24, 48, or 72 h with 0.4 mM Bt2cAMP. Cell lysates were harvested and separated in a 10% SDS-PAGE gel followed by western blotting using anti-ASAH1 or anti-GAPDH antibodies. (B) Graphical analysis of data obtained in western blotting studies of ASAH1 protein expression in cells treated for 24 to 72 h with 0.4 mM Bt2cAMP. Data graphed represent the mean±SEM of two separate experiments, each carried out in triplicate. Asterisks indicate a statistically significant difference compared to untreated controls (p<0.05). (C) H295R cells were treated for 24 to 72 h with 0.4 mM Bt2cAMP and cell lysates were isolated and for ceramidase assays as described in the Materials and methods section. Plates were developed in chloroform:methanol:25% NH4OH (90:20:0.5, v/v/v) and visualized by fluorescence scanning on a Typhoon Trio Scanner. NBD-dodecanoic acid formation was quantified and normalized to the protein content of each sample. Data graphed are the mean±STD of two experiments each performed in duplicate. Asterisks indicate a statistically significant difference compared to untreated controls (p<0.05).

