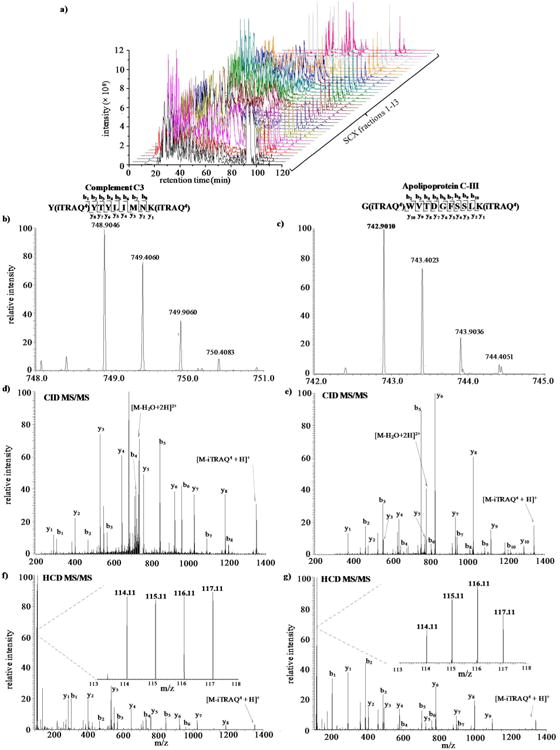
Figure 1.

a) LC chromatograms for individual SCX fractions analyzed in triplicate. Example mass spectra of peptides eluted from b) SCX fraction 7 tr = 57.20 min with m/z 748.8046 and c) SCX fraction 6 tr= 37.26 min with m/z 742.9010. CID MS/MS spectra are shown in d) and e), respectively. HCD MS/MS are shown in f) and g). The inserts are zoom-ins of the f) and g) low m/z region.
