Figure 5.

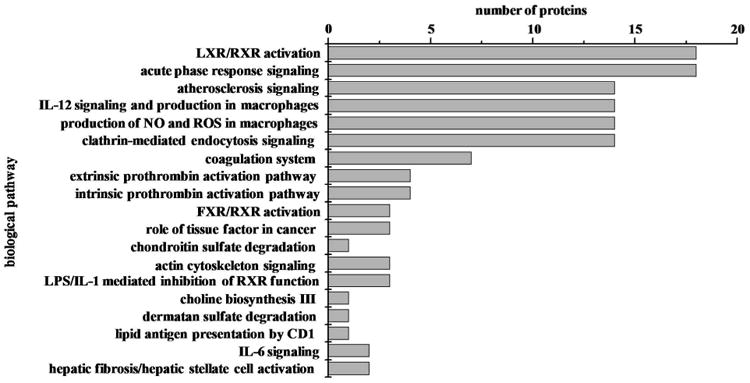
Histogram plot of biological pathways associated with differentially expressed proteins as a function of severity of sepsis (N=58). The p value cutoff for the IPA pathways is p<0.05.

Histogram plot of biological pathways associated with differentially expressed proteins as a function of severity of sepsis (N=58). The p value cutoff for the IPA pathways is p<0.05.