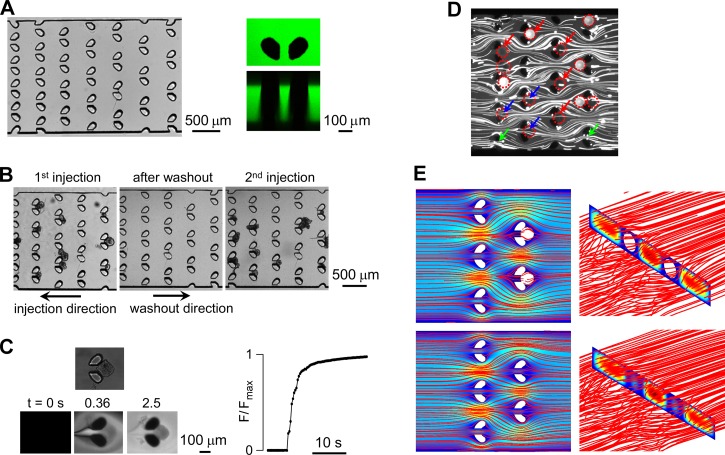
Figure 2.
Characterization of microfluidic channel. (a) Images of trap region of the channel showing top view by light microscopy (left) and top and side views by fluorescence confocal microscopy in which the channel was filled with an aqueous solution of FITC (fluorescein isothiocyanate)-dextran. (b) Release of trapped enteroids by reversal of flow direction, showing reuse with reinjection of enteroids. (c) Solution exchange time measurement around a trapped enteroid (left, top) showing fluorescence micrographs at indicated times after exchange between a non-fluorescent and fluorescent solution at a perfusion rate of 200 μl/min. Graph at right shows integrated fluorescence around the enteroid. (d) Experimental determination of streak-flow obtained by visualization of 7 μm fluorescence particles around post-pairs. (e) Three-dimensional numerical simulation using Comsol Multiphysics of flow pattern around post-pairs showing streamlines and pseudo-color velocity field in the mid-plane (left) and vertical plane (right).

