Figure 3.
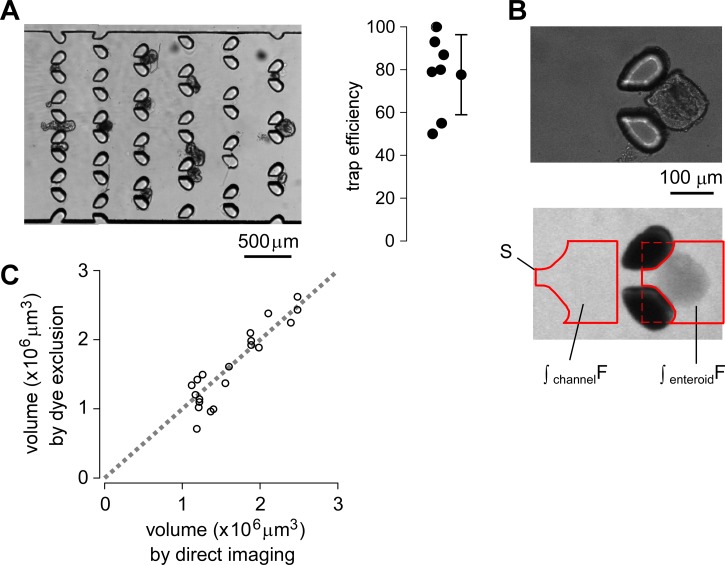
Trap efficiency and volume measurement by fluorescent dye exclusion. (a) Light micrographs showing trapped enteroids (left) and deduced trap efficiency (right). For each test 20–30 enteroids with diameters of 50–300 μm were injected, and trapping efficiency was determined by counting the number of trapped vs. total enteroids in the trap region. (b) Light (top) and wide-field fluorescence (middle) micrographs obtained with 10× objective lens showing the shadow cast by dye exclusion. The fluorescence signals are integrated over indicated areas in the enteroid-occupied region and an enteroid-free region (bottom). (c) Comparison of bubble volumes determined by dye exclusion (ordinate) with actual volumes determined by light microscopy (abscissa).

