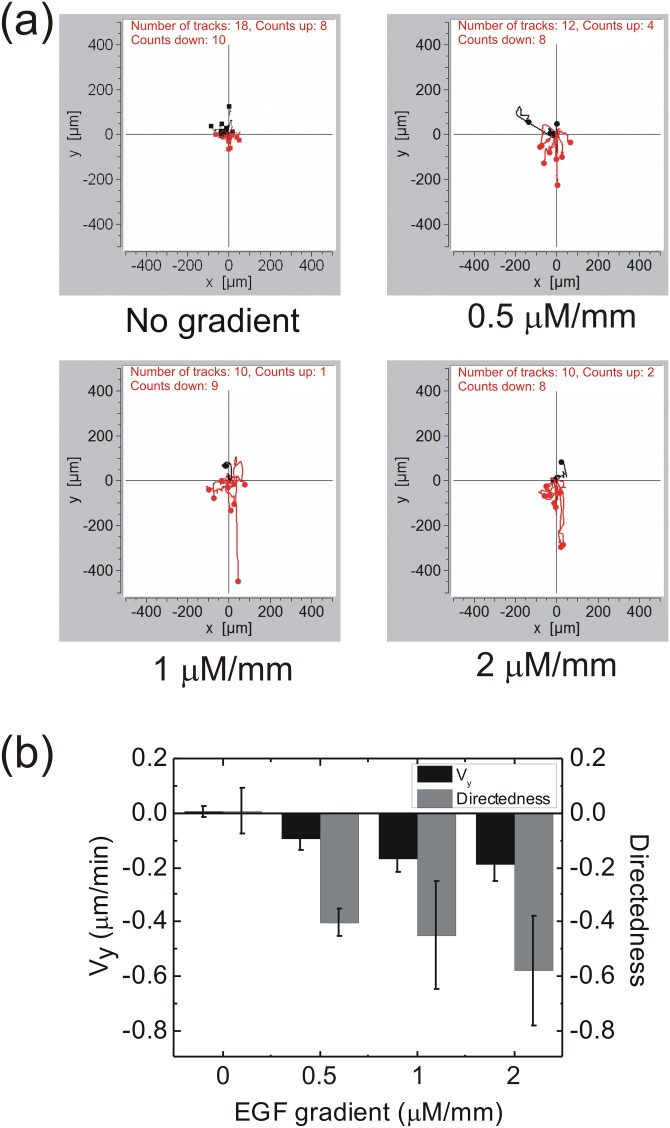
Figure 3.
(a) CL1-5 cell migration paths under the influences of four EGF concentration gradients. The thick channel containing the EGF was in the negative y-direction. The black paths are those with the end in the positive y-axis region; while the red paths are those with the end in the negative y-axis region. (b) Directedness and Vy of cells under various EGF concentration gradients. Error bar, standard error of the mean.

