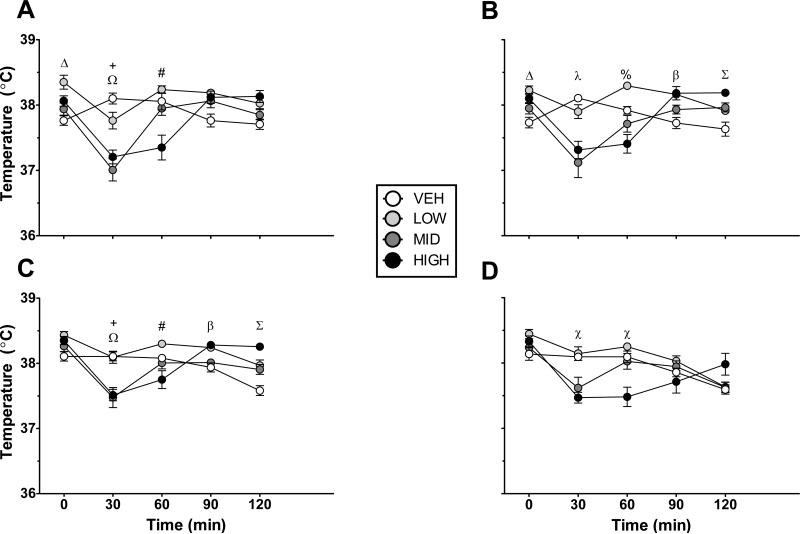
Figure 4.
Mean (± SEM) body temperature (°C) of adolescents across the five intervals (0, 30, 60, 90, 120) over the four conditioning trials (Panels A-D). Δdenotes a significant difference between Groups 0 and 1.0. +denotes a significant difference between Group 0 and Groups 1.8 and 3.2. Ωdenotes a significant difference between Groups 1.0 and 1.8. #denotes a significant difference between Groups 1.0 and 3.2. λdenotes a significant difference between Groups 0 and 1.8. %denotes a significant difference between Group 1.0 and Groups 1.8 and 3.2. βdenotes a significant difference between Group 0 and Groups 1.0 and 3.2. Σdenotes a significant difference between Group 0 and Group 3.2. Xdenotes a significant difference between Groups 0 and 1.0 and Group 3.2.

