Figure 2.
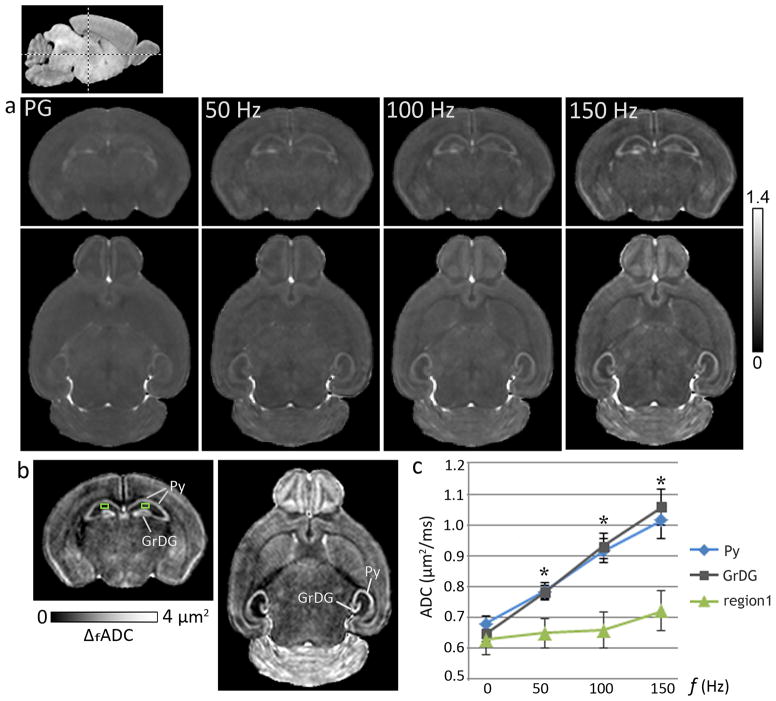
Oscillating-gradient diffusion MRI revealed region-specific contrast enhancement in the neonatal mouse brain. a) ADC maps of a coronal (top panel) and an axial (bottom panel) section at the level of the hippocampus from a P8 brain, derived with pulsed-gradient (PG) and oscillating-gradient (50, 100, and 150 Hz) diffusion-weighted sequences are shown. The anatomic locations of the sections are indicated in the scout sagittal image at the top left. The units of ADC shown are μm2/ms. b) Maps derived from a linear fitting of the ADC measurements with gradient frequency (ΔfADC) revealed anatomical contrasts highlighting the pyramidal cell layer in the hippocampus (Py) and the granular cell layer in the dentate gyrus (GrDG). c) Plot of ADC measurements versus gradient frequency shows the significantly higher frequency-dependent ADC increase observed in the Py and the GrDG layers compared to adjacent hippocampal regions, e.g., a region in the CA1 subfield (region 1, indicated by the green squares in (b)). Averaged ADC measurements from both left and right hippocampal layers from P8 control mice are shown, with the pulsed-gradient measurements denoted by 0 Hz. *indicates significant (p <0.005) differences in ADC values in both Py and GrDG layers compared to region 1. Error bars indicate standard deviations (n=5).

