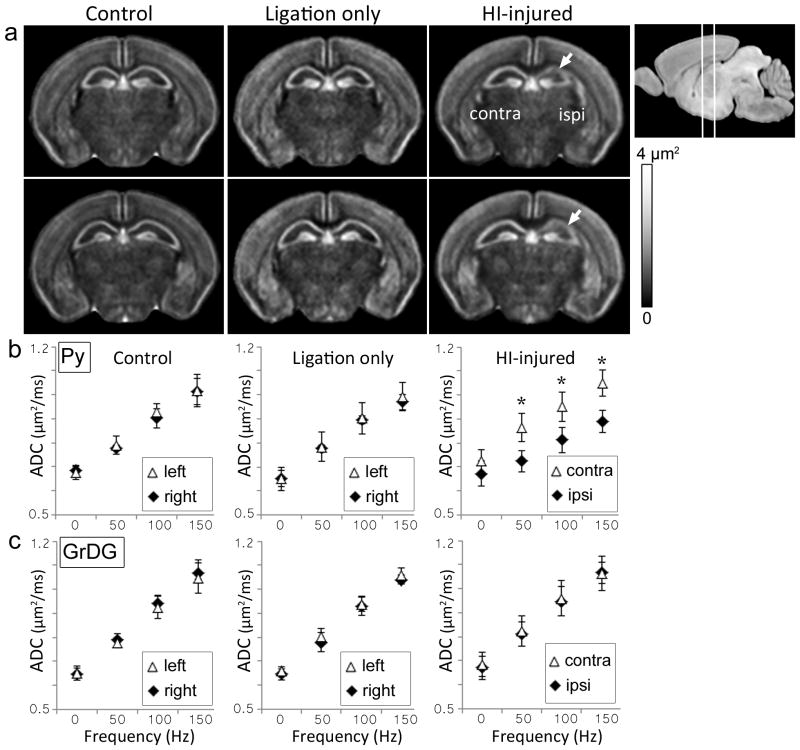
Figure 4.
Oscillating-gradient diffusion MRI of control, sham-operated (unilateral carotid artery ligation only), and HI-injured mouse brains at P8. a) Group-averaged ΔfADC maps of control (n=5), ligation-only (n=3), and HI-injured (n=5) mouse brains show two coronal sections at the level of the hippocampus. The anatomical locations of the sections are shown in the scout image at the top right. White arrows indicate regional decrease in ΔfADC measurements in the ipsilateral hippocampus observed in the HI-injured group. b–c) Plots of ADC values (mean ± standard deviation) versus gradient frequency for the Py and GrDG regions for the three cohorts. Mean ADC measurements from symmetric regions-of-interest in the left and right hippocampal layers are shown. Error bars represent standard deviations across subjects for each group. *indicates significant (p<0.005) differences in ADC measurements between the contralateral and ipsilateral regions.

