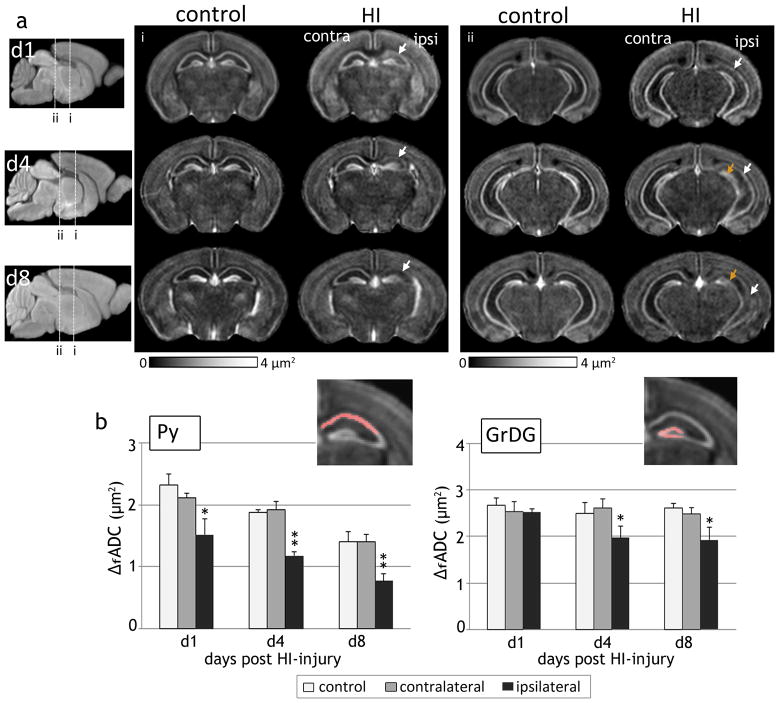
Figure 5.
Spatiotemporal evolution of ΔfADC contrasts in the mouse hippocampus after exposure to neonatal HI at P7. a) Group-averaged ΔfADC maps of control and HI-injured mouse brains at 1, 4, and 8 days following injury (at P8, P11 and P15, n=5 per group at each time point) show the regional and temporal progression of injury in the ipsilateral Py (white arrows) and GrDG (orange arrows) regions. Two coronal sections at the level of the hippocampus at each age are shown. The anatomical locations of the sections are indicated in the group-averaged iDW scout images at each age. b) Quantitative measurements of ΔfADC values (mean ± standard deviation, n=5) in the Py and GrDG regions from control and HI-injured groups at 1, 4 and 8 days following HI. Values shown are measured from symmetric regions-of-interest in the contralateral and ipsilateral hippocampal regions (shown in the inset images). *p<0.01 and **p<0.005 compared with measurements from the contralateral hippocampus.

