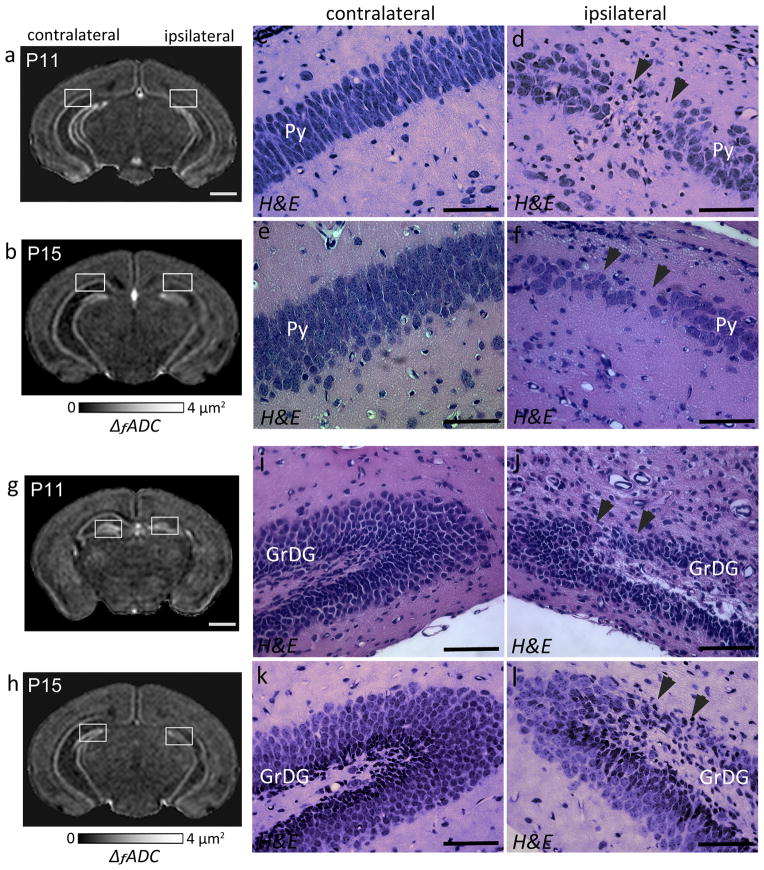
Figure 6.
ΔfADC contrasts and histological evaluation showing regional neurodegeneration in the ipsilateral hippocampal layers at 4 (P11) and 8 (P15) days post exposure to HI-injury. a–b) Coronal sections through a P11 (a) and a P15 (b) mouse brain show regional decrease in ΔfADC in the ipsilateral Py layer compared to the contralateral side. c–f) High-magnification views of H&E-staining through the hippocampi of the same mice (corresponding to the areas within the white squares in a and b, respectively). The H&E-stained sections show regional neuronal loss and reduced cell density in the ipsilateral Py layer (black arrowheads) compared to the contralateral region at 4 (c,d) and 8 (e,f) days after the injury. g–h) Coronal sections showing regional decrease in ΔfADC in the ipsilateral GrDG layer, at P11 (g) and P15 (h). i–l) High-magnification views of H&E-stained sections corresponding to the white squares in g and h show regional neuronal loss in the GrDG layer of the ipsilateral hippocampus (black arrowheads). Scale bars for the MR images = 1 mm. Scale bars for the histology sections = 200 μm.

