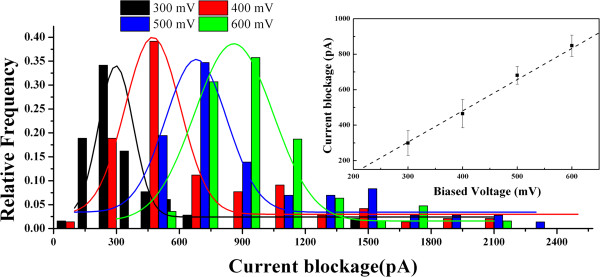
Figure 3.

Current blockage histograms as a function of applied voltage at medium voltages. The histograms of current amplitude are normalized by fitting with Gaussian distribution; a linear increase of the means of current amplitude as a function of voltage can be clearly visualized in the inset. The numbers of translocation events at 300, 400, 500, and 600 mV are 102, 123, 156, and 160, respectively.
