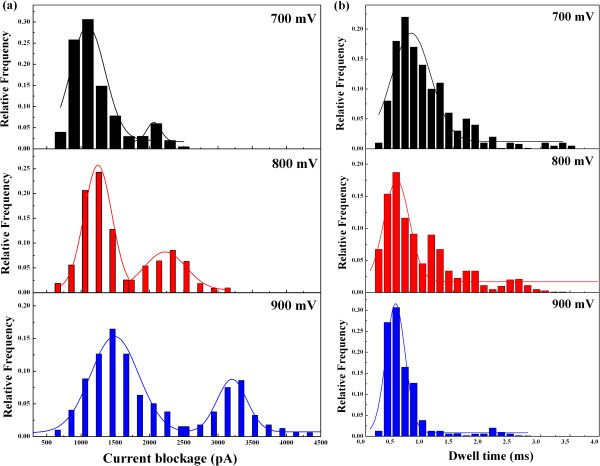
Figure 6.
Current blockage histograms as a function of applied voltage at high voltages. (a) The histograms of current amplitude are normalized at voltages of 700, 800, and 900 mV. Multiple peaks with greater amplitude appear. (b) The histograms of time duration are fitted by Gaussian distribution at voltages of 700, 800, and 900 mV.

