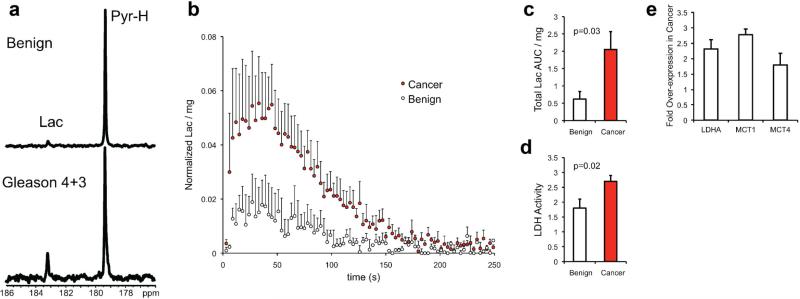
Fig. 5.
a: A single spectrum taken at 90 sec post-injection of HP [1-13C] pyruvate in the bioreactor with benign (N = 4) or malignant TSCs (N = 4). b: Average HP Lactate dynamics for TSCs. c: Total normalized lactate area under the curve (AUC) and (d) LDH activity for be nign and malignant TSCs. e: mRNA expression of lactate dehydrogenase A (LDHA), monocarboxylate transporters1 (MCT1) and 4 (MCT4). All plots are represented as mean ± SE.

