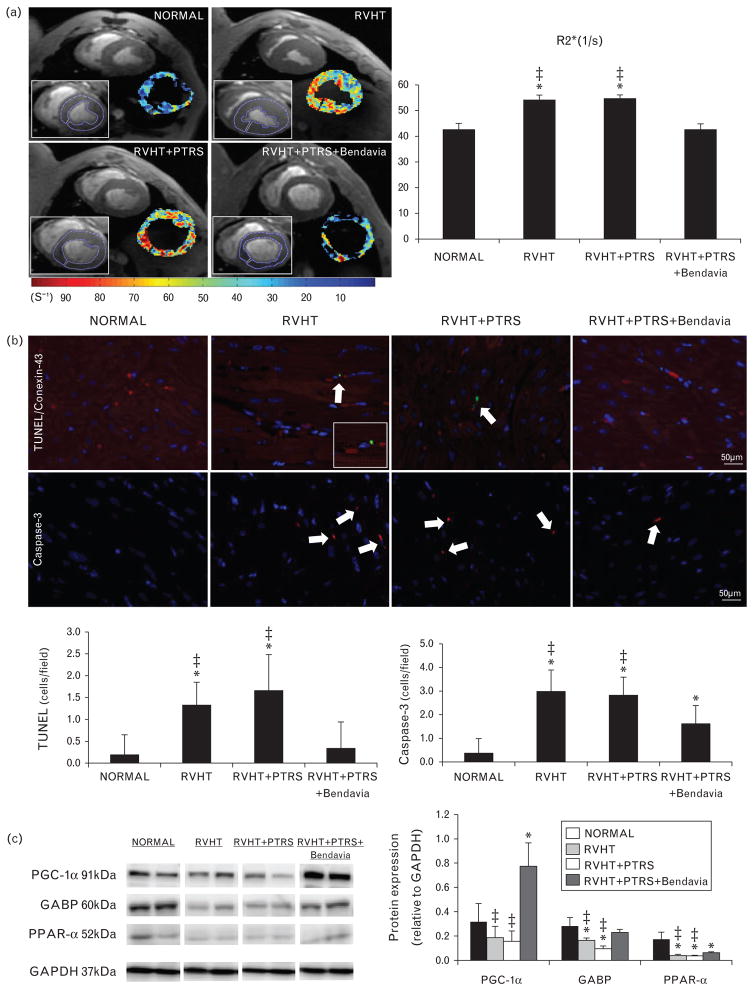
FIGURE 2.
(a) Representative left ventricular cross-sectional images of blood oxygen level-dependent (BOLD) MRI, showing hypoxic myocardium (red) in renovascular hypertension (RVHT) and quantification of R2* signal in the study groups. (b) Double immunofluorescence staining with terminal deoxynucleotidyl transferase dUTP nick end labeling (TUNEL, green) and connexin-43 (red), and single caspase-3 (red) staining (top), and their quantification (bottom). (c) Myocardial expression of peroxisome proliferator-activated receptor gamma coactivator (PGC)-1α, guanine adenine-binding protein (GABP), and peroxisome proliferator-activated receptor (PPAR)-α. *P ≤0.05 vs. normal; ‡P <0.05 vs. RVHT +PTRS +Bendavia. PTRS, percutaneous transluminal renal angioplasty and stenting.

