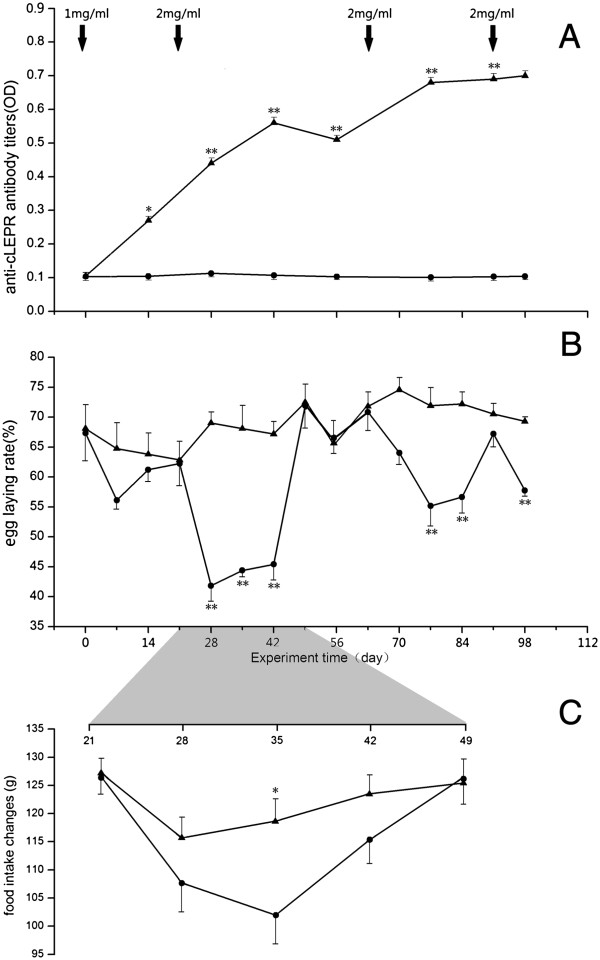
Figure 1.
Changes of anti-cLEPR antibody titer, egg laying rate, and feed intake between Control hens ( , n = 30) and cLEPR Immunized hens (
 , n = 30). (A) Changes of anti-cLEPR antibody titer in hen plasma (B) Changes of egg laying rate (C) Changes of feed intake. Vertical bars represent standard errors of the mean. Asterisks indicate significant differences (*:P < 0.05, **:P < 0.01). Arrows indicate administration of BSA and cLEPR immunogens and dose.

