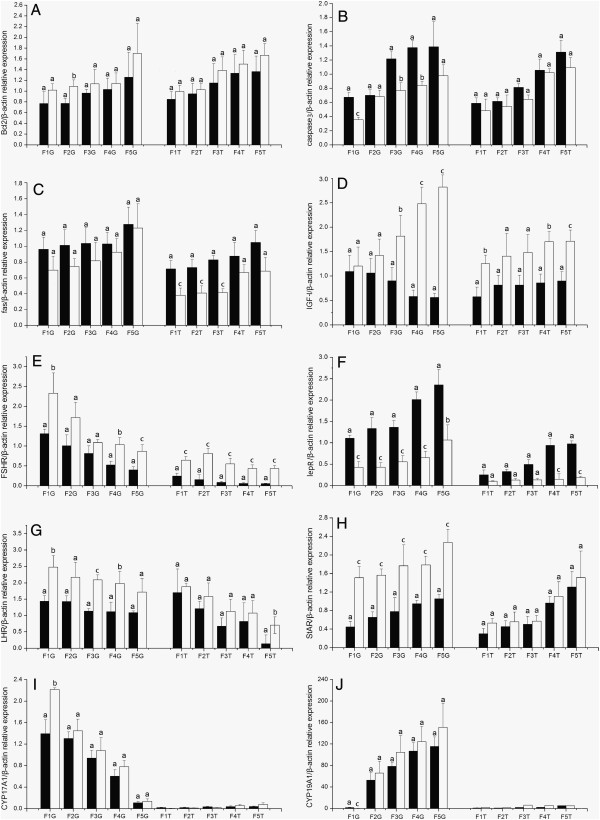
Figure 3.
The levels of mRNA expression relative to β-actin of ten genes in thegranulosa (G) and thecal (T) layer of various size ovarian follicles in Control hens (□, n = 8) and cLEPR Immunized hens (■, n = 8). (A)bcl2(B)caspase3(C)fas(D)IGF-I(E)FSHR(F)lepR(G)LHR(H)StAR(I)CYP17A1(J)CYP19A1. Fn represents the hierarchical order of follicle size, with the largest follicle designated as F1. Vertical bars represent the standard errors of the mean. Means not marked by a common letter are significantly different (a-b: P < 0.05; a-c: P < 0.01).

