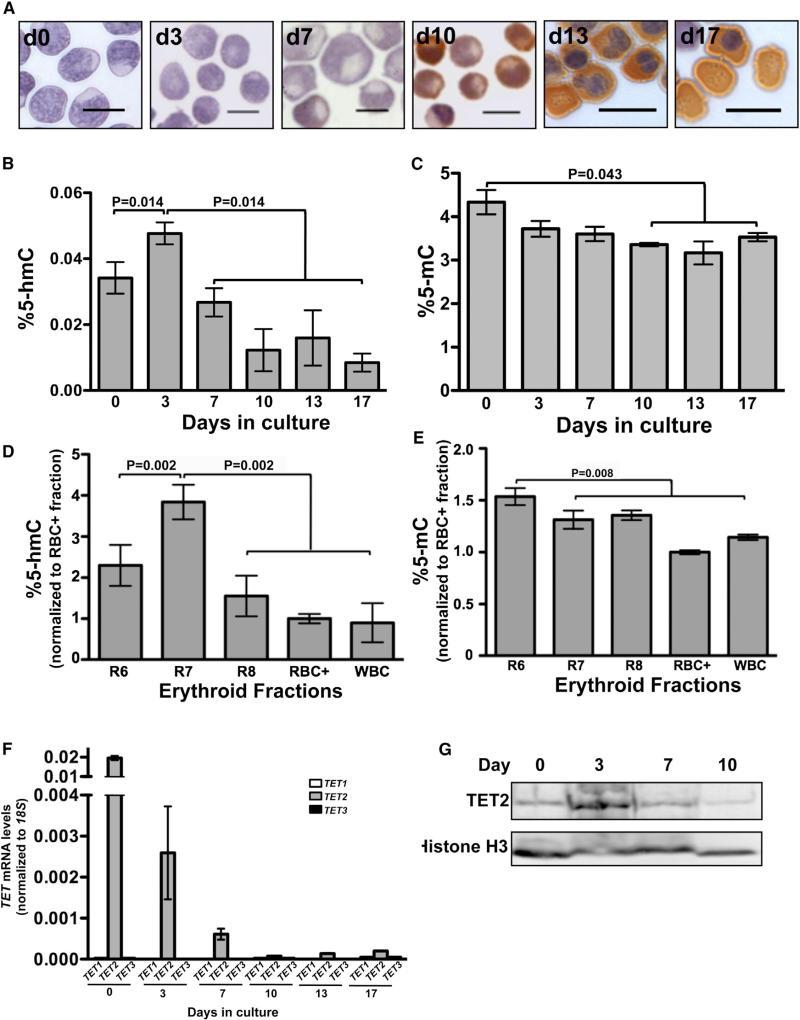
Figure 1. Dynamic Changes in 5-hmC and 5-mC Levels during Erythroid Differentiation.
(A) Photomicrographs of hematoxylin and benzidine-stained cells cytospun onto slides on the days indicated. Changes in cellular morphology as well as acquisition of HB (brown) during the differentiation program are seen in the micrographs.
(B and C) Total 5-hmC (B) and 5-mC (C) content in cells at days 0, 3, 7, 10, 13, and 17 during in vitro erythroid differentiation, measured by LC-MS. The average (± SD) of two independent biological replicates obtained from two independent donor CD34+ cells is shown. Repeated measures ANOVA was used to determine statistical significance.
(D) Total 5-hmC content in the erythroid fractions isolated from baboon bone marrow. “R6” is the CD117+ CD36 bRBC fraction of cells, which form granulocytic, mixed, and large BFUe colonies in methylcellulose. This population contains both early progenitors and later nonerythroid progenitors. “R7” is the CD117+CD36+ fraction, which forms CFUe and late BFUe in methylcellulose (10%–20% erythroid colony-forming cells). “R8” is the CD117– CD36+ bRBC– fraction, which does not form colonies in methylcellulose. “RBC+” is the fraction of erythroid precursors that do not form colonies and that were purified using Miltenyi Biotec columns with the baboon-specific red blood cell (RBC) antibody (BD Biosciences). All numbers were normalized to RBC+ values. White blood cell (WBC) was used as a control. Data are represented as the mean of two independent biological replicates ± SD.
(E) Total 5-mC content in the erythroid fractions isolated from baboon bone marrow, as described in (D). Data are represented as the mean of two independent biological replicates ± SD.
(F) qRT-PCR for TET1 (white bars), TET2 (gray bars), and TET3 (black bars) expression normalized to 18S, at days 0, 3, 7, 10, 13, and 17 during in vitro erythroid differentiation. The average (± SD) of two independent biological replicates is shown.
(G) Representative western blot showing expression of TET2 protein in nuclear extracts from cells at days 0, 3, 7, and 10. The blot was stripped and reprobed for histone H3, the loading control.
See also Figure S1 and Table S1.

