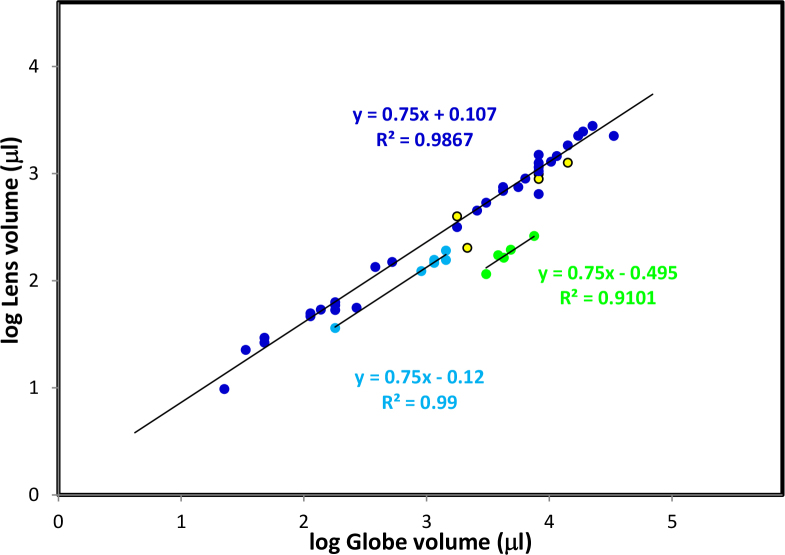
Figure 5.
Allometric analysis of the relationship between eye axial length and lens volume. Lens volumes were calculated from the wet and dry weights using the relationship, volume=wet weight - (1-ρ)dry weight, where ρ is the partial specific volume of proteins. Axial lengths were obtained from the compilation of Howland et al. [4]. Data for related species were grouped and colours were assigned to the groups – bats (black), birds (light blue), carnivores (red), ectothermal species (reptiles, amphibians, fish, yellow with black outline), lagomorphs (purple), marsupials (dark green), primates (light green), rodents (orange with black outline), tree shrew. (light green with black outline) and ungulates (dark blue).

