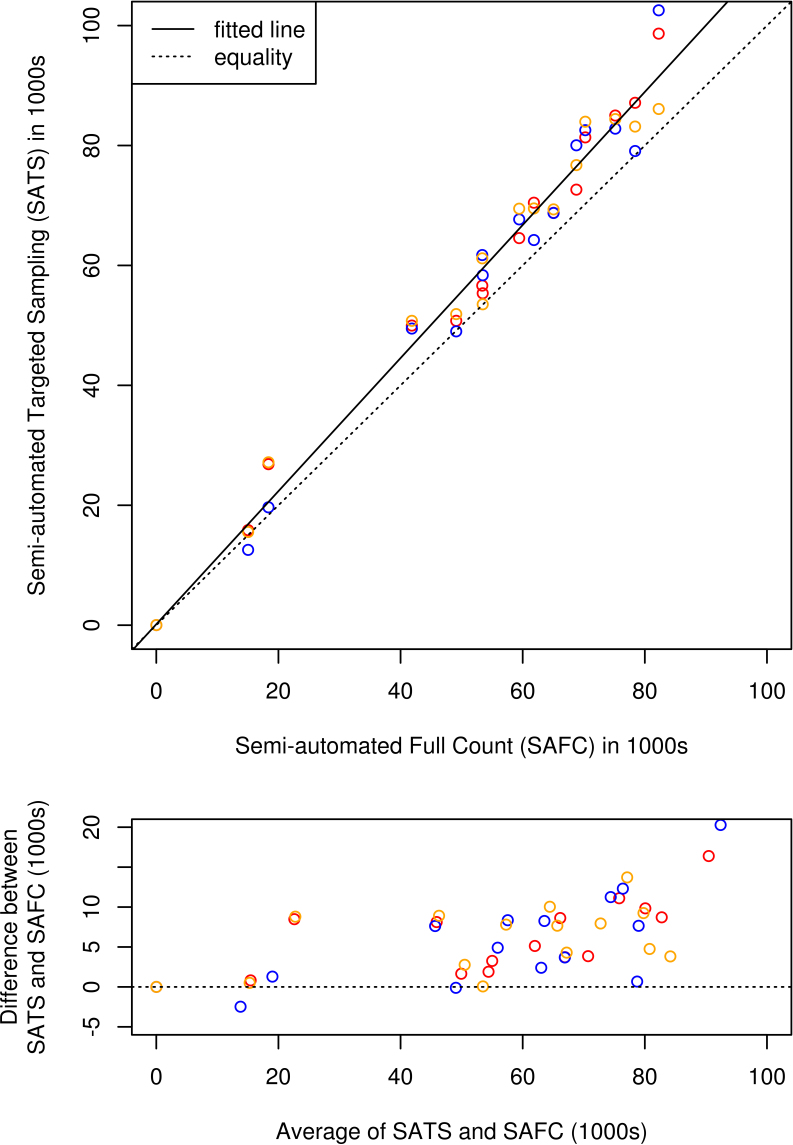
Figure 4.
Degree of agreement between semi-automated targeted sampling (SATS) and semi-automated full count (SAFC) methods. The top panel shows a scatter plot of SATS counts performed by three raters versus the SAFC count for each of n=15 optic nerve cross sections. Raters are identified by plot symbol color, the dotted line represents equality of the counting methods, and the solid line represents the best linear fit. The bottom panel shows a Bland-Altman plot of the differences versus the average of the two counting methods.

