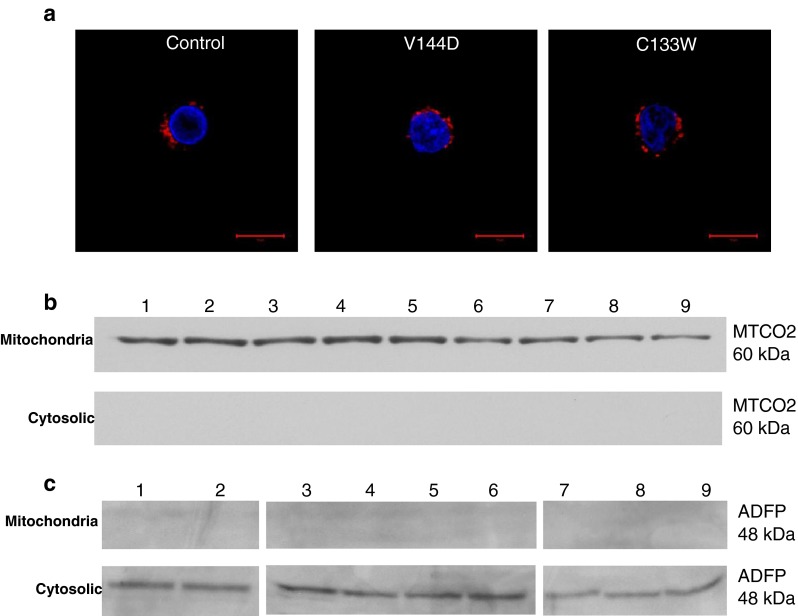
Fig. 4.

Mitochondria show no co-localisation with lipid droplets. a Representative confocal micrographs showing MTCO2 stained mitochondria (red) and DAPI nuclear stain (blue). Scale bar = 20 μm. b Immunoblot detection of MTCO2 at 60 kDa from mitochondrial and cytosolic fractions, 1–3 represents oleic acid-treated controls; 4–6, treated V144D mutants; and 7–i, treated C133W mutants. c Immunoblot detection of ADFP at 48 kDa from oleic acid-treated mitochondrial and cytosolic fractions
