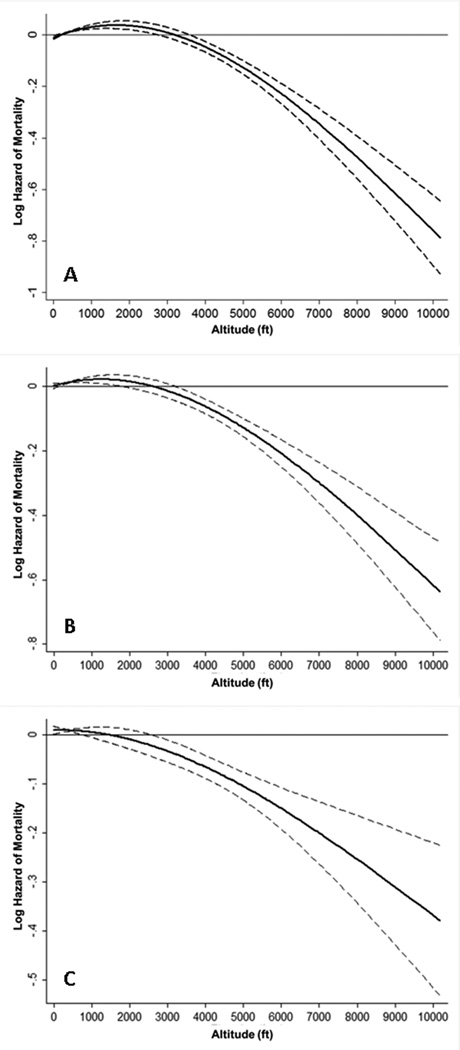
Figure 2.
Association of average residential altitude with mortality in 144,892 dialysis patients over 8 years (7/2001–6/2009). Figure 2A represents unadjusted analyses, while figures 2B and 2C represent case-mix adjusted analyses, and case-mix + MICS adjusted analyses, respectively.
Footnote: The Y-axis shows the logarithm of the hazard ratio of all-cause mortality over 8 years in. unadjusted, case-mix adjusted, and case-mix + MICS adjusted models. The unadjusted model adjusts only for calendar quarter covariate. The case-mix model adjusts additionally for age, sex, dialysis modality, race, diabetes, dialysis vintage, insurance, marital status, dialysis dose, erythropoietin-α dose, and the following comorbidities: alcohol dependence, smoking, atherosclerotic heart disease, congestive heart failure, chronic obstructive pulmonary disorder, cerebrovascular disease, peripheral vascular disease, and cancer. The case-mix + MICS model adjusts further for albumin, calcium, bicarbonate, creatinine, ferritin, hemoglobin, lymphocyte, normalized protein nitrogen appearance, phosphorus, white blood cell count, alkaline phosphatase, parathyroid hormone, and body mass index. Dashed lines represent 95% pointwise confidence bands.

