
Figure 1.
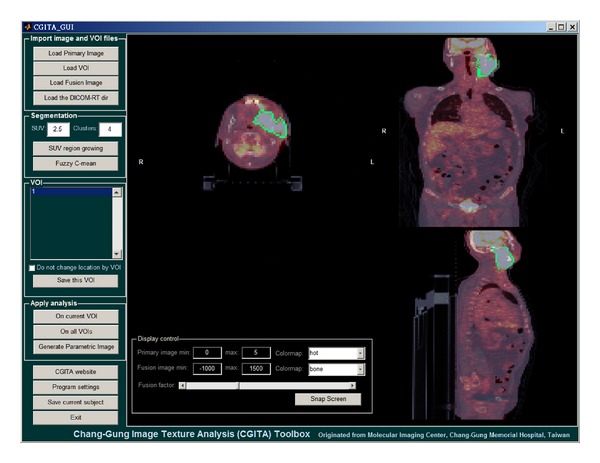
A screen shot of the CGITA program. The CGITA GUI provides users with a simple image display interface that allows users to examine different slices and views. The computation of heterogeneity indices is achieved simply by button clicking. As an open-source project, the current functions and interfaces of CGITA can be customized by users familiar with MATLAB programming. The screen shot here shows a subject with the FDG-PET images fused over CT images.