
Figure 7.
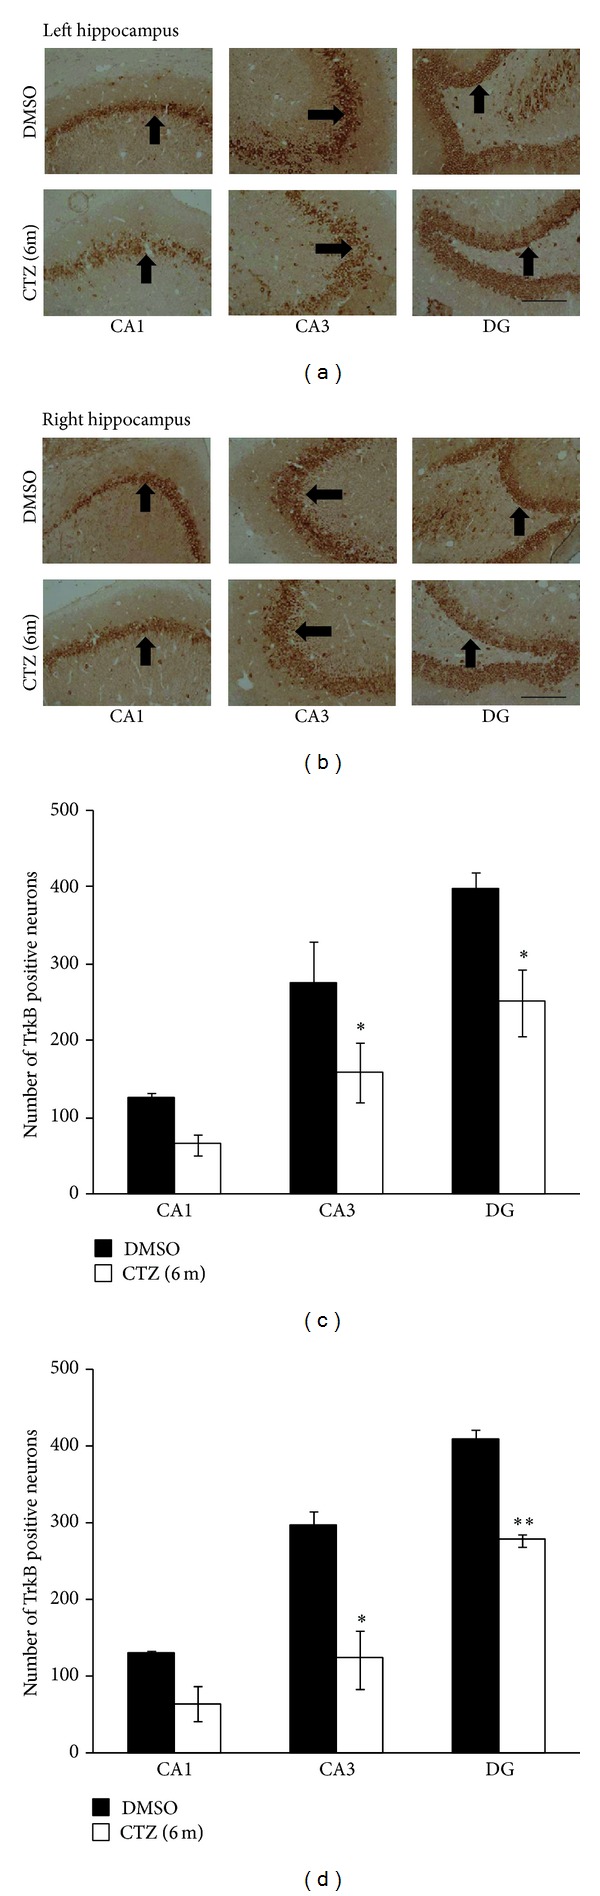
Decreased TrkB staining in hippocampus of recurrent seizure rats induced by CTZ. (a-b) Pictures showing TrkB positive cells (arrow indicated) in left (a) and right (b) hippocampus from rats 6 months after either DMSO (top) or CTZ (bottom) treatment. (c-d) Group data showing significant decreases of the TrkB staining cells in CA1, CA3, and DG area of the hippocampus from rats 6 months after either DMSO (n = 3) or CTZ (n = 3) treatment. *P < 0.05, **P < 0.01, compared to the DMSO control group. Scale bar in (a) and (b): 200 μm.