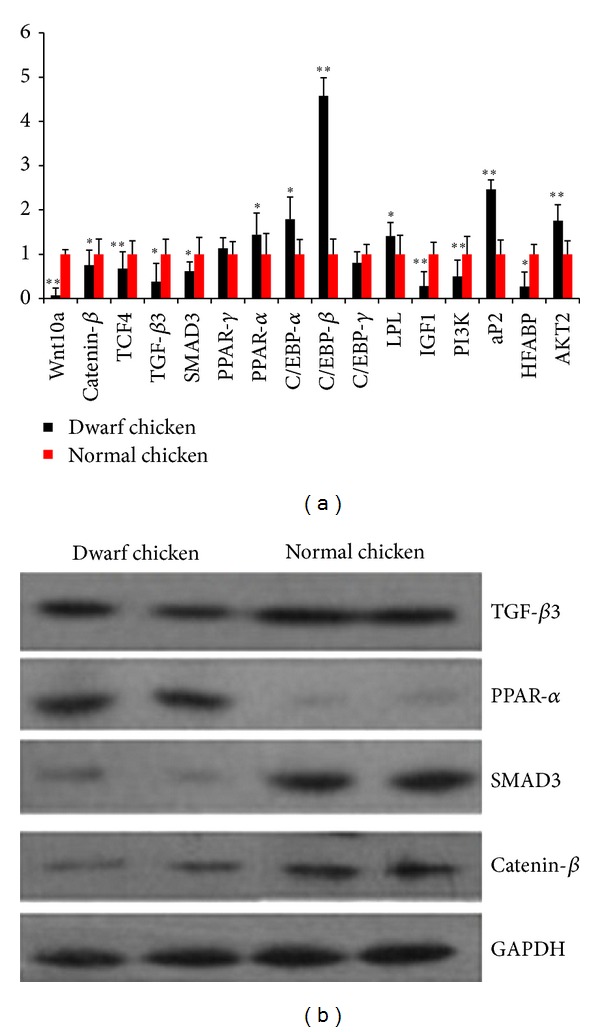
Figure 3.

(a) The mRNA expression of some signaling pathway factors was measured by qRT-PCR. Data were normalized using β-actin mRNA and were presented as the mean ± S.E.M of the three experiments, n = 10/group. Data are representative of three separate experiments. Note: *P < 0.05, **P < 0.01 versus normal groups. (b) Western blot analysis of indicated proteins: catenin-β, TGF-β3, SMAD3, and PPAR-α protein expression in normal and dwarf chicken skeletal muscles. GAPDH was used as loading and transfer control. Representative blots are shown.
