
Figure 3.
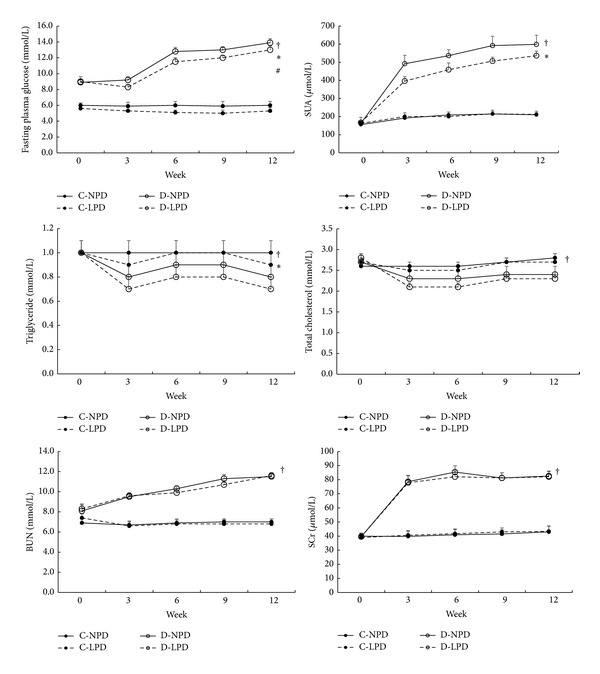
Time course of blood biochemical indexes among different rat groups. Solid circle with solid and dashed lines represents C-NPD and C-LPD group, respectively, while hollow circle with solid and dashed lines shows data of D-NPD and D-LPD group, respectively. Data were expressed as mean ± SD. † P < 0.05 for D-LPD versus C-NPD rats, *P < 0.05 for D-NPD versus D-LPD group, and # P < 0.05 for C-NPD versus C-LPD group in the global trend comparisons. SUA: serum uric acid, BUN: blood urea nitrogen, SCr: serum creatinine.