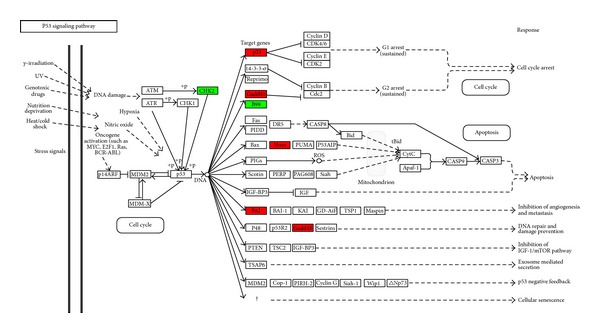
Figure 2.

Representation of the p53 signaling pathway map from KEGG. The genes identified as regulated in 10 μm Cd-treated HepG2 cells are colored in the p53 signaling pathway map. The genes in red are upregulated and those in green are downregulated. Genes identified as regulated have a false discovery rate corrected P value smaller than 0.05 and fold change greater than 2.
