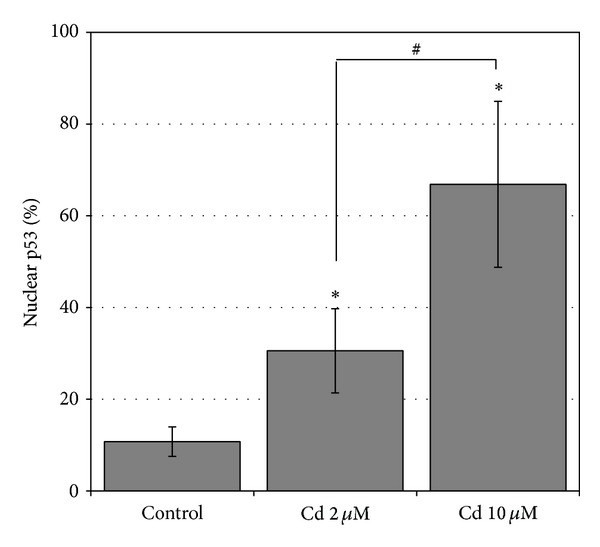
Figure 5.

Quantification of the p53 nuclear localization. Percentage (mean ± SD) of HepG2 cells showing the p53 nuclear localization in the controls and in Cd-treated cells (2 and 10 μM). The mean ± SD values of at least 3 independent samples are shown; a number of 400 < n < 1000 cells were counted. Significantly different from control: *P < 0.5; significantly different between Cd treatments: # P < 0.05.
