Figure 2.

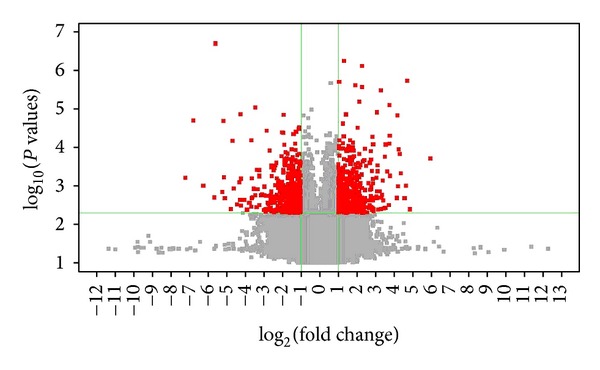
Hypertension induced gene changes compared with normal control rats. Note: model = spontaneous hypertension rats (SHR) model group, and control = normotensive Wistar-Kyoto rats control group.

Hypertension induced gene changes compared with normal control rats. Note: model = spontaneous hypertension rats (SHR) model group, and control = normotensive Wistar-Kyoto rats control group.