Figure 1.

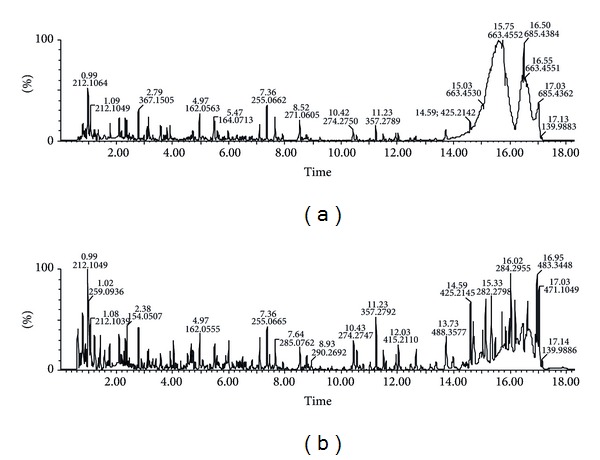
Base peak intensity (BPI) chromatograms obtained from the positive ion UPLC-MS analyses of control (a) and diet-induced hyperlipidemia (b) rats.

Base peak intensity (BPI) chromatograms obtained from the positive ion UPLC-MS analyses of control (a) and diet-induced hyperlipidemia (b) rats.