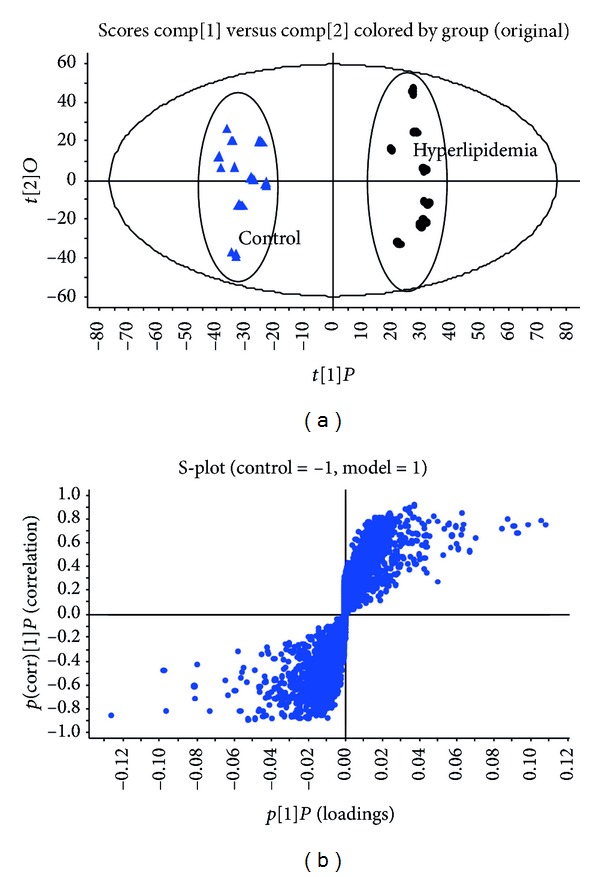
Figure 2.

(a) OPLS-DA score plot based on the urinary metabolic profiling of the hyperlipidemia (●) and control (▲) rats; the results indicated that the urinary metabolic pattern was significantly changed in the diet-induced hyperlipidemia rats. (b) S-plot used in our biomarkers selection. The variables marked (□) are the metabolites selected as potential biomarkers. The significant metabolites were selected as potential biomarkers from S-plot and these urinary metabolites are associated with diet-induced hyperlipidemia.
