Figure 1.

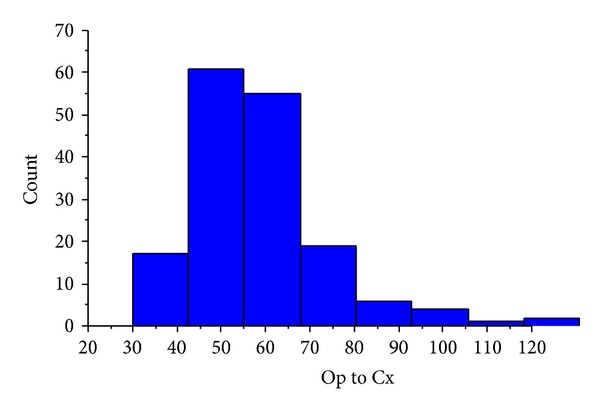
Distribution of time intervals from operation to commencement of chemotherapy (for inclusion in online publication only).

Distribution of time intervals from operation to commencement of chemotherapy (for inclusion in online publication only).