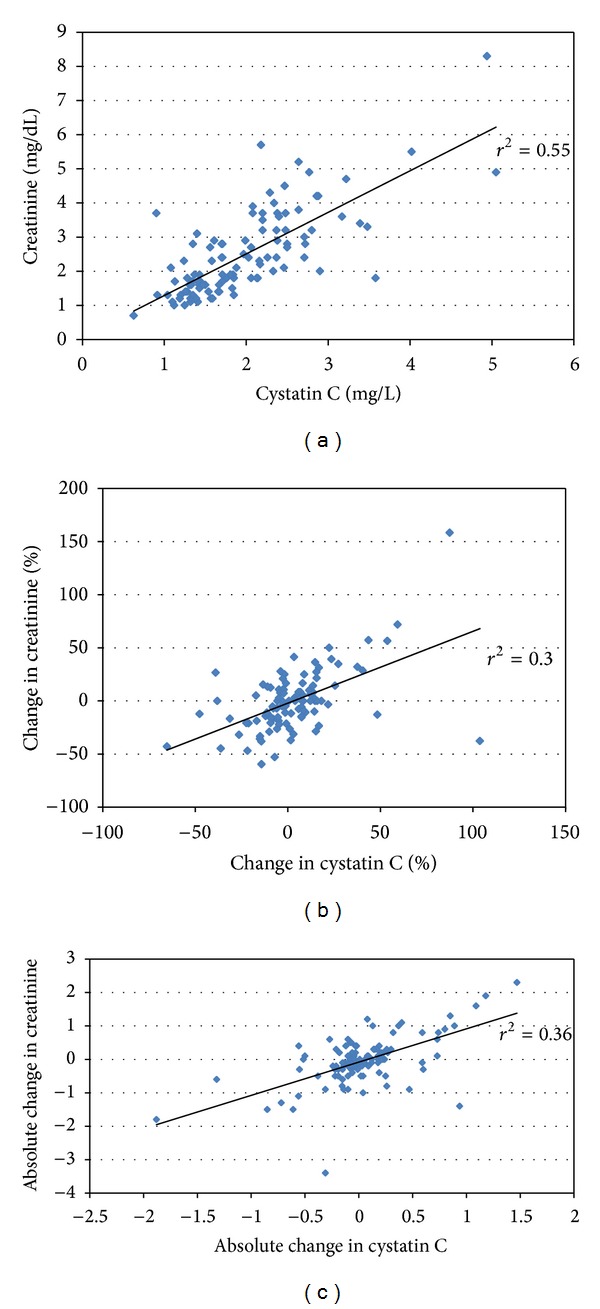
Figure 1.

Correlation between creatinine and cystatin. (a) Correlation between creatinine and cystatin C values from first sample collection. (b) Correlation between relative changes in creatinine and cystatin C values from first to last sample collection. (c) Correlation between absolute changes in creatinine and cystatin C values from first to last sample collection.
