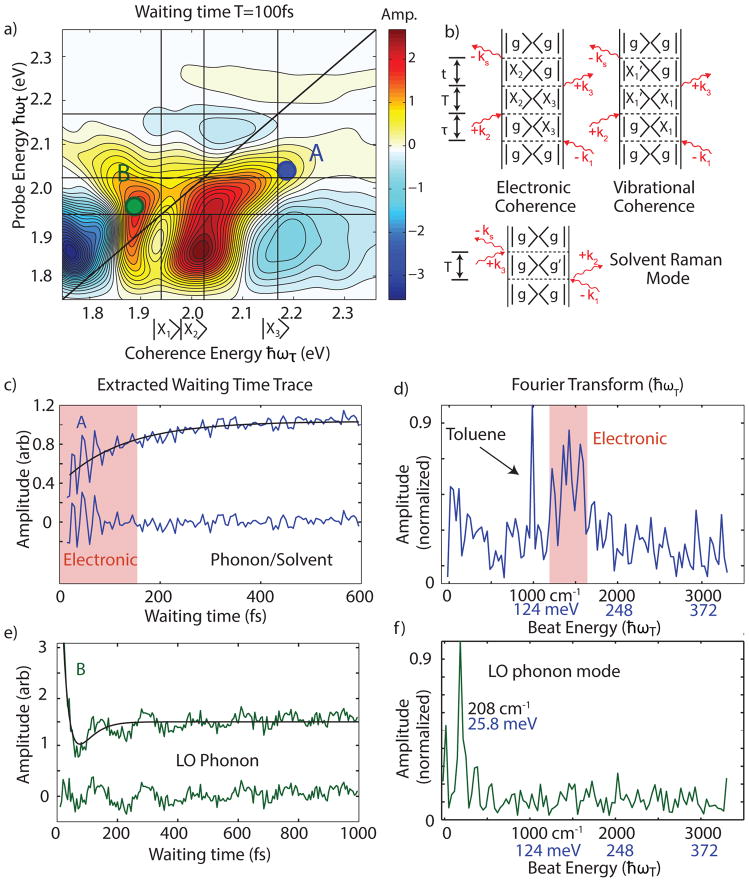
Figure 2.
a) Two dimensional spectrum, with A representing the 1P/1S crosspeak, and B highlighting the band-edge feature. b) Feynman diagrams representing stimulated emission coherent oscillatory (rephasing τ>0) contributions to the signal, and coherent solvent response. The arrows represent electric field interactions, which interact with the density matrix of the ensemble. Coherences are off-diagonal elements of the density matrix, which during waiting time create oscillatory signals in 2D spectra. c) We plot the raw signal from A and the residual upon subtraction of a two fit exponentials representing population dynamics during waiting time. This shows large amplitude early time coherent response, followed by smaller amplitude oscillatory signals. d) A Fourier transform of the residual signal showing a broad peak centered at 1500 cm−1, assigned in this work to electronic coherence and a narrow peak near 1000 cm−1 which we assign to the dominant Raman active mode in toluene. We attribute the apparent structure underneath the electronic coherence to additional solvent modes or to experimental noise. e) and f) show the same analysis as c) and d) for the band edge feature B, which oscillates with the longitudinal optical phonon mode.

