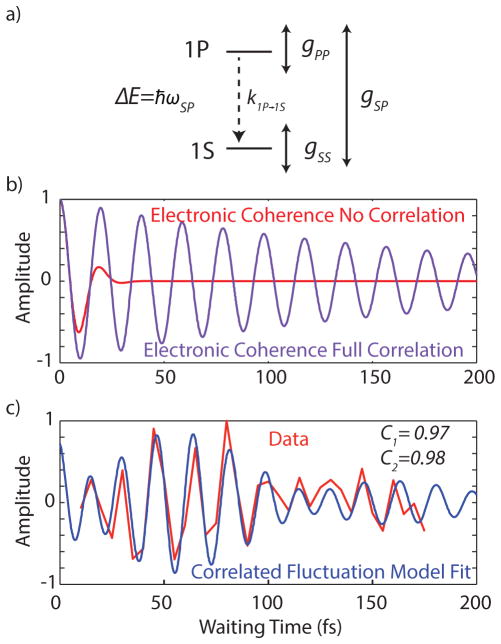
Figure 4.
a) A representation of the terms from equation 4; ωSP represents the energy difference between states, k1P→1S is the rate of relaxation, gSS and gPP are the lineshape functions which represent the fluctuations of each state, and gSP describes degree to which those fluctuations are shared (or correlated). b) Two extreme cases, where the fluctuations are completely uncorrelated (leading to dephasing on a 10 fs time scale, or completely correlated, leading to dephasing only from population relaxation. c) Data from point D from figure 3, which shows two frequencies, for which we fit the model described in supporting information, given known lineshape parameters. The fit shows a high degree of correlation (C=0.97 or C=0.98 for the two observed modes, respectively) is needed to reproduce the observed excitonic lifetimes.

