Fig. 1.
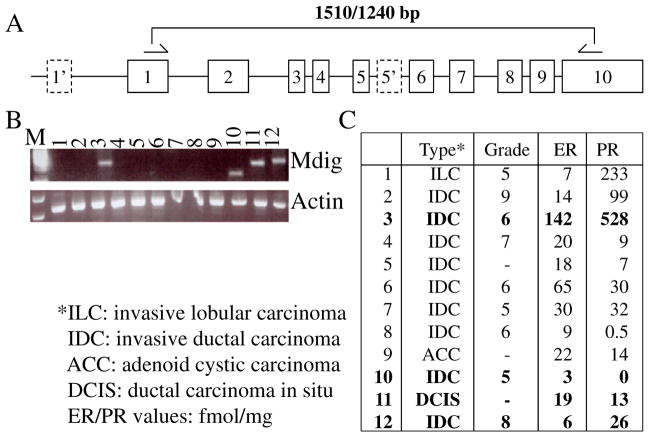
Detection of mdig mRNA in breast cancer samples. A. Schematic indication of the mdig gene structure. Dashed boxes indicate alternative exons identified in some alternatively spliced mdig mRNAs. Half arrows denote the corresponding regions of the PCR primers. B. Expression of mdig in the indicated breast cancer samples. The expression levels of mdig were calibrated by β-actin. C. Tumor and patient information of B.

