
Figure 2. L.donovani DNA equivalents measured by qPCR, quantitated by extrapolating to a standard curve with known numbers of parasite.
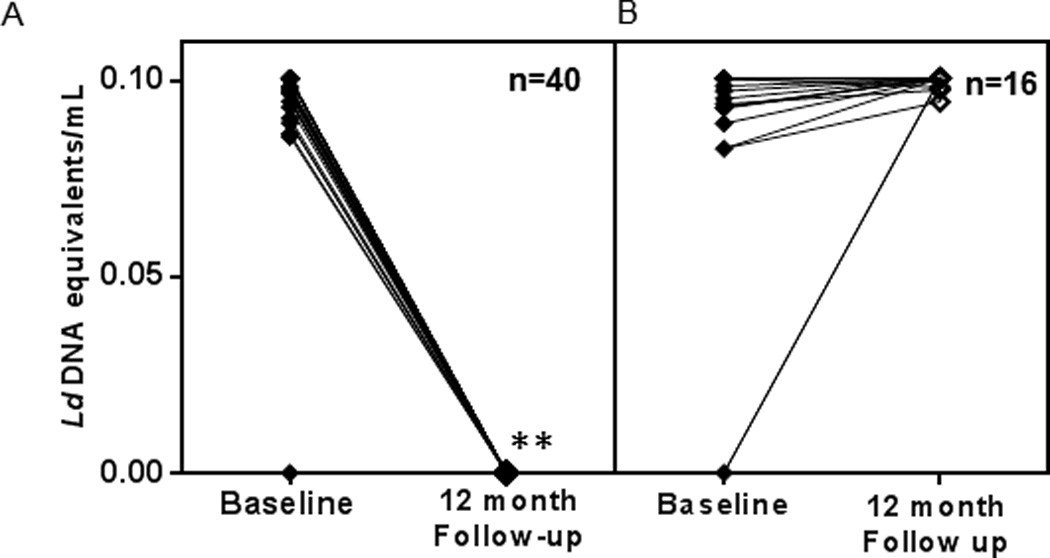
A) Progression of L.donovani DNA loads of the 40 study subjects who tested PCR negative at 12 month follow-up. B) Progression of L.donovani DNA loads of the 16 study subjects who tested PCR positive at 12 month follow-up. Each line represents an individual tested at baseline and follow-up and n represents the number of individuals. **L.donovani DNA equivalents at baseline and follow-up were significantly different as measured by a p value of 2.5*e−9 by a paired, 2- tailed t-test.