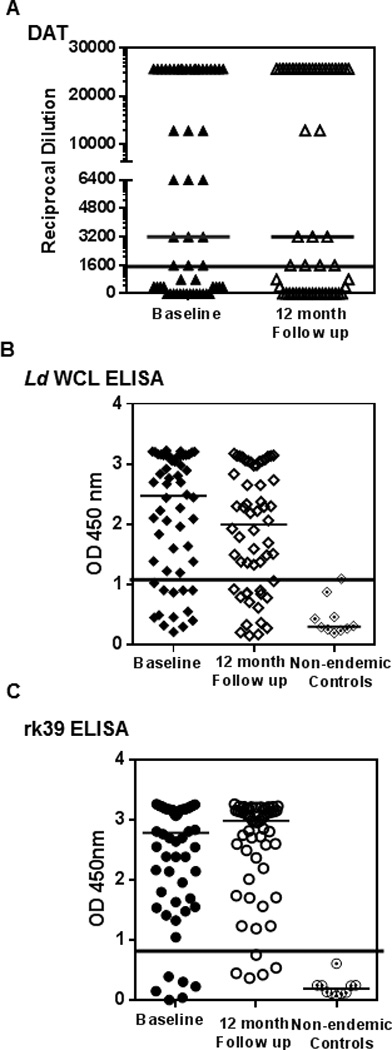
Figure 3. Distribution of sero-reactivity of asymptomatic individuals at baseline and follow-up.

A) Comparison of the reciprocal serum dilution at which agglutination was observed by DAT of individuals at baseline (closed triangles) and follow-up (open triangles). Black line represents cut- off for positivity at 1600 B) Comparison of OD at 450 nm of individuals at baseline and follow-up by antibody detection ELISAs against L.donovani WCL (closed and open diamonds) along with non- endemic controls (dotted diamonds). Black line represents cut- off OD for positivity at 1.05 C) Comparison of OD at 450 nm of individuals at baseline and follow-up by antibody detection ELISAs against rk39 (closed circles) along with non- endemic controls (dotted circles). Black line represents cut- off OD for positivity at 0.89. Medians for each distribution are represented by black bars. No significant differences between baseline and follow-up measurements were seen for any of the serological tests.
