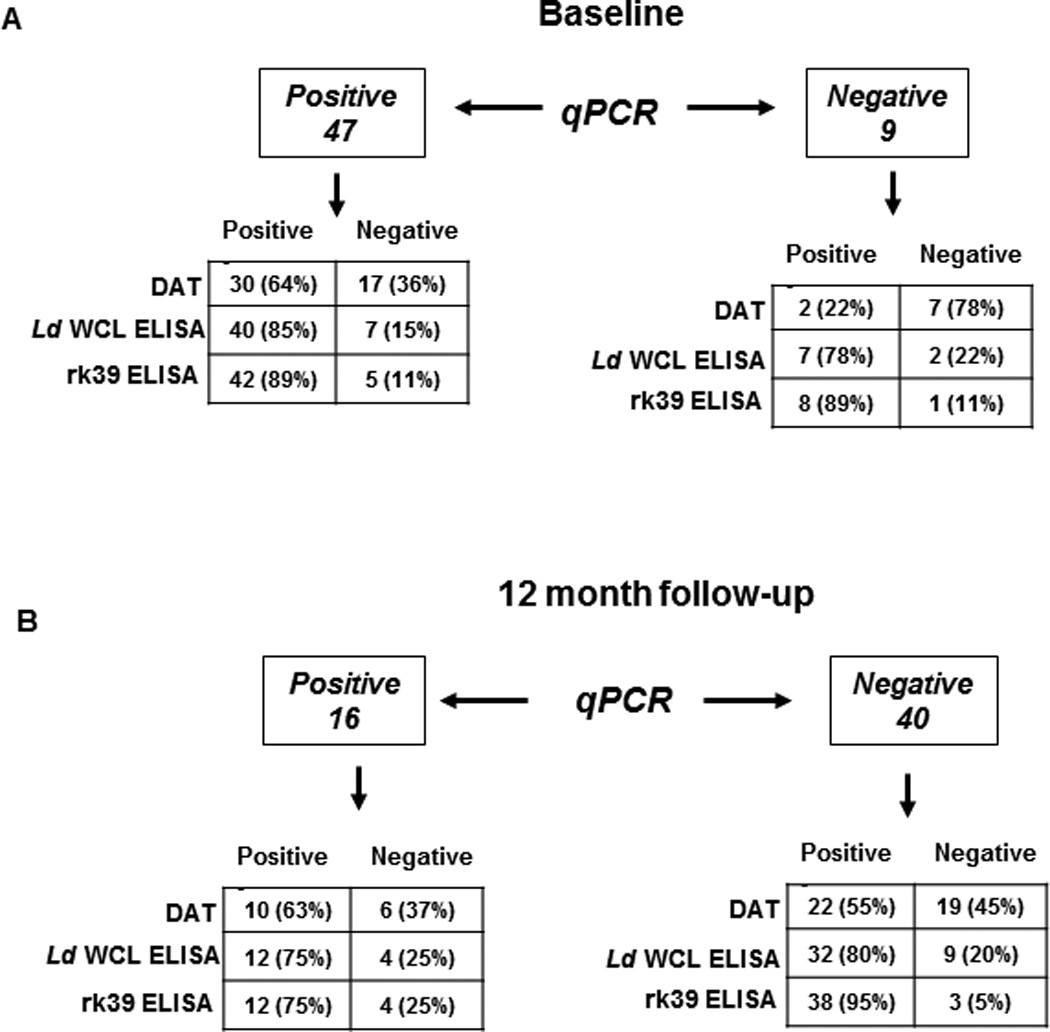
Figure 4. Correlation between qPCR and serological tests in asymptomatic individuals.

The distribution of qPCR positive and negative individuals as detected by DAT, L.donovani WCL and rk39 ELISA has been depicted. A) Correlation of qPCR positivity and negativity with DAT, L.donovani WCL and rk39 ELISA at baseline. Number of individuals positive or negative followed by percent positive or negative in parenthesis. B) Correlation of qPCR positivity and negativity with DAT L.donovani WCL and rk39 ELISA at 12 month follow-up.
