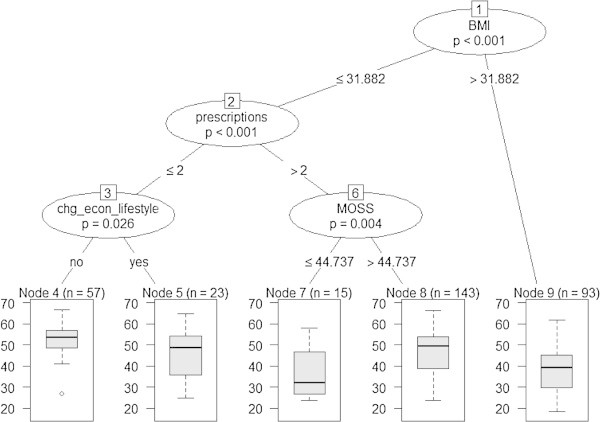
Figure 1.

Conditional inference tree model for SF-36 Physical Component Summary (PCS) score (n=331). Notes: Correlation between actual and predicted= 0.47, P<.0001; Predicted SF-36 PCS per terminal node: Node 4= 52.54; Node 5= 45.72; Node 7= 36.70; Node 8= 46.47; Node 9= 38.46.
