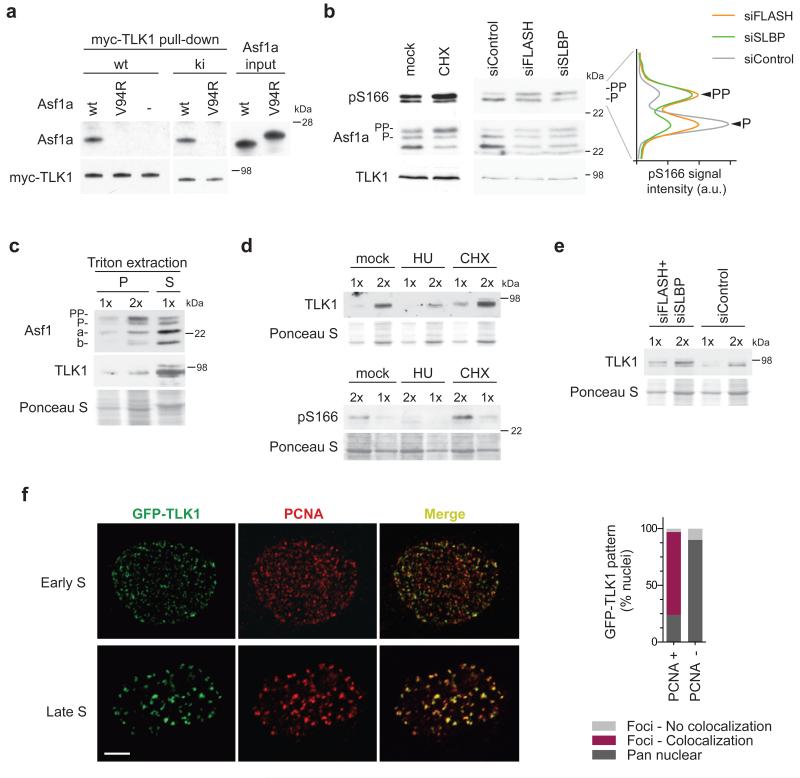
Figure 6. TLK1 localizes to replication sites and phosphorylates histone-free Asf1.
(a) In vitro binding assay. Recombinant Asf1a wild-type (wt) or histone-binding mutant (V94R) was incubated with myc-TLK1 wild-type (wt) or kinase-inactive (ki) isolated from insect cells. (b) Western blot of Asf1a phosphorylation in S phase cells treated with CHX for one hour or siRNAs against FLASH and SLBP (siFLASH, siSLBP). Graph was generated as in Fig. 1f. One representative experiment out of two biological replicas is shown. (c) Distribution of TLK1 and Asf1 between the Triton soluble (S) fraction and chromatin pellet (P) in S phase cells. (d, e) Analysis of TLK1 and Asf1a pS166 in the chromatin pellet in cells treated with HU and CHX for one hour (d) or siRNAs against FLASH and SLBP (siFLASH+siSLBP) (e). (f) GFP-TLK1 localization analyzed in conditional U-2-OS cells by co-staining with PCNA after pre-extraction of soluble proteins with Triton. Representative images of early and late S phase cells are shown. Scale bar, 5 μm. The graph shows quantification of GFP-TLK1 localization patterns in PCNA positive (+) and PCNA negative (−) cells. P and PP denote different Asf1a phosphorylation states. One representative experiment out of two biological replicas is shown. More than 100 cells were analyzed in each experiment.

