
Figure 2.
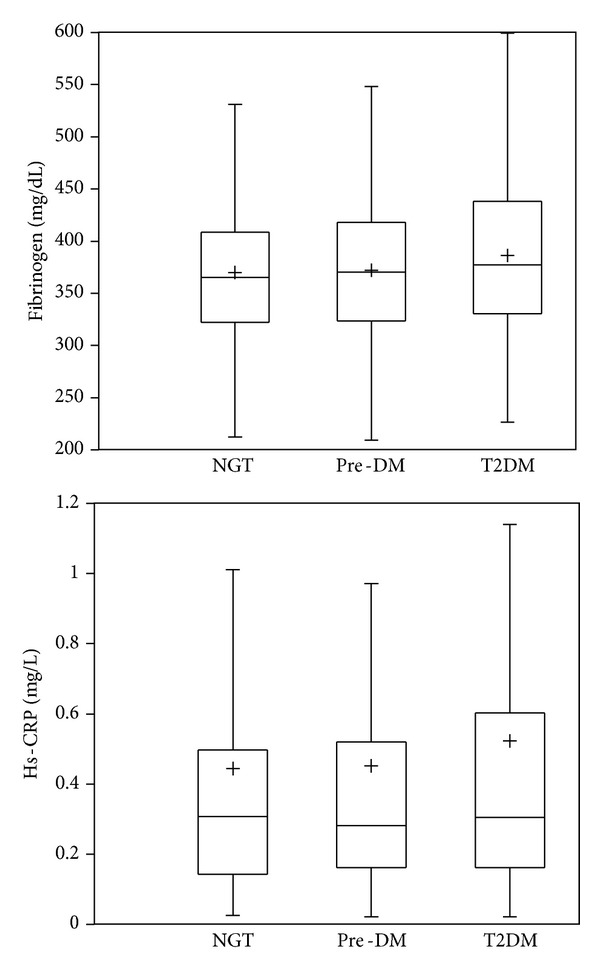
Box plots showing plasma levels of fibrinogen and hs-CRP according to glucose tolerance status. Fibrinogen showed significant difference between NGT and T2DM (P = 0.01), but it was not between NGT and pre-DM (P = 0.71). The hs-CRP concentration was statistically different between NGT and T2DM (P = 0.05), but it was not between NGT and preDM (P = 0.89). + = mean.