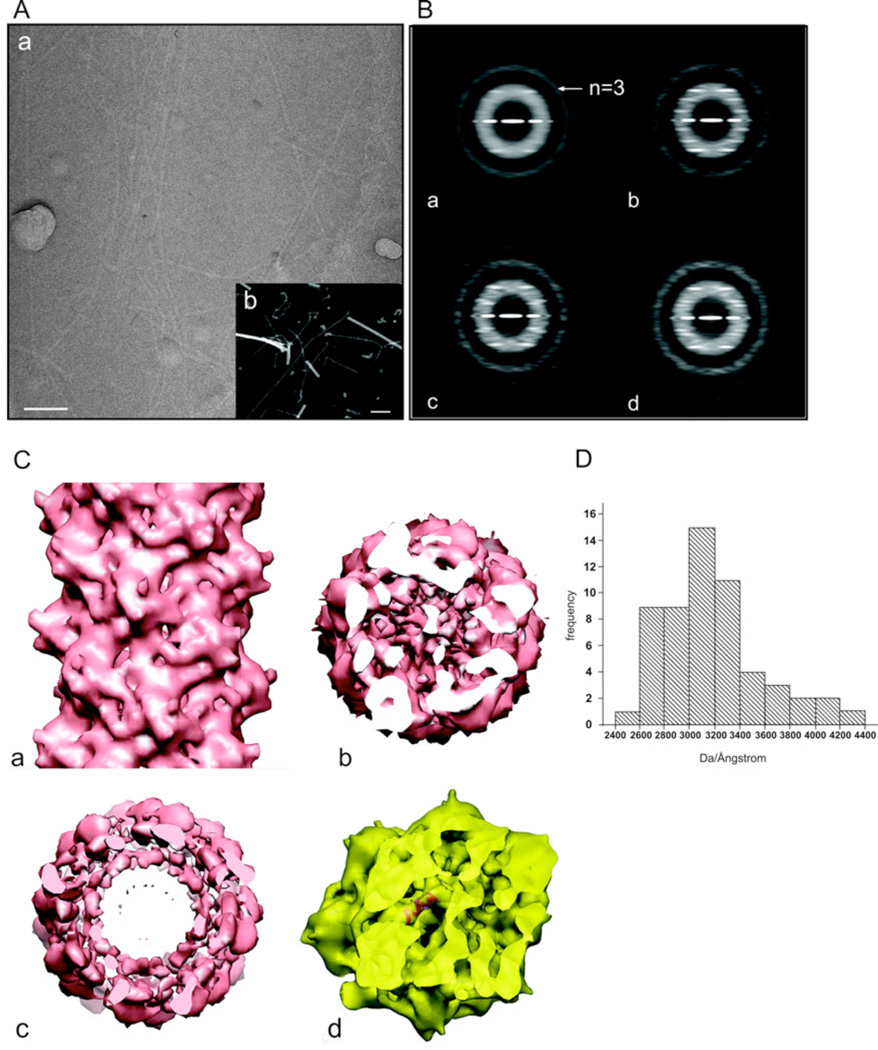
Figure 3.
Electron microscopic analysis of the aap pili. (A) Electron microscopic images of the pili by cryo-EM of unstained frozen-hydrated samples (a), and by scanning transmission electron microscopy (STEM) of unstained freeze-dried samples (b). The filaments in (a) are imaged in a hole present in a carbon film, while the filaments in (b) are on a solid support. The larger objects in (b) are tobacco mosaic virus particles, used as an internal mass standard. The scale bars are 100 nm. (B) Power spectra from cryo-EM images of the pili. (a) A power spectrum from the entire set of segments (n=21,369) shows only a single layer line, identified as |n|=3, that is at a spacing of ~ 1/(41 Å). Sorting the population by twist and axial rise yields subsets that show three layer lines at relatively low resolution, Three examples are shown: (b) 136.9°, 5.7 Å. This is the subset that was used for subsequent reconstructions, and contained 4,613 segments. The near equatorial layer line would therefore be n=−8, and the layer line below the n=−3 would be n=+5; (c) 138.9°, 6.7 Å; (d) 137.9°, 6.2 Å. To boost the signal-to-noise ratio in the images and to correct for phase reversals introduced by the defocus of the microscope, all electron micrographs were multiplied by the contrast transfer function determined for that micrograph. This produces the very visible Thon rings in the power spectra. (C) A side (a) and top (b) view of the three-dimensional reconstruction of the pili. A single α-helix fits very nicely into the tubular densities seen in the inner core of the reconstructed volume (c), consistent with the notion that the hydrophobic N-terminal α-helices are forming this core, with the globular heads on the outside of the filament. (D) A histogram of mass per unit length measurements of the pili determined by STEM.

