Fig. 2.
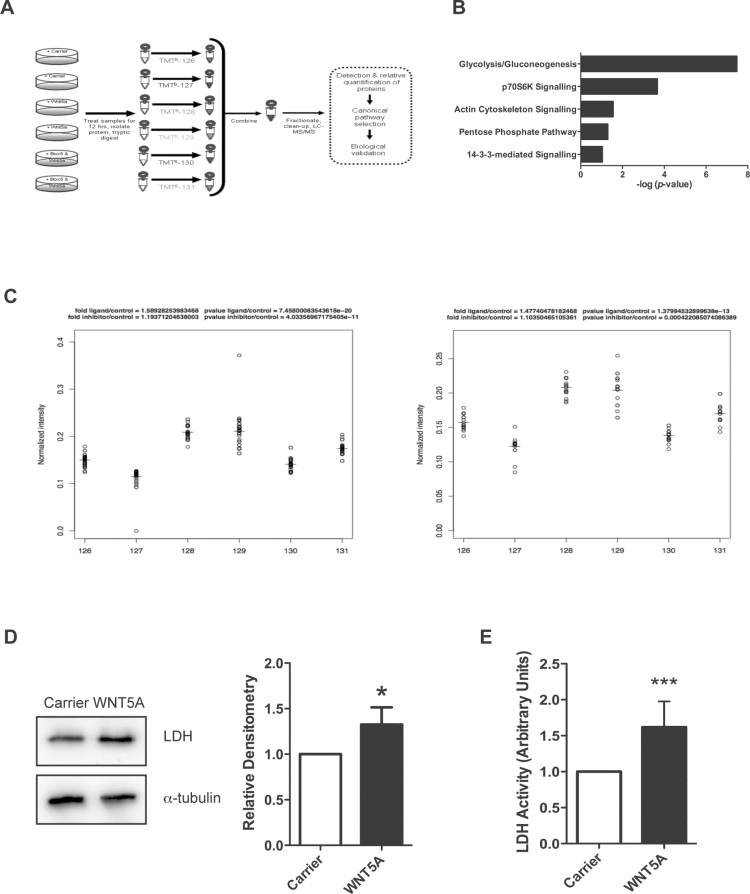
Proteomics analysis of WNT5A signalling in A2058 melanoma cells reveals changes to cellular metabolism machinery. (A) Schematic diagram of the experimental design for the proteomics screen. (B) WNT5A-regulated proteins were categorized into top canonical-affected pathways using the IPA Ingenuity® Knowledge Base dataset (Ingenuity Systems; bar chart; P value generated by a Fisher’s exact test). (C) Peptide spread plots of the LDH gene products from the proteomics data set. Each peptide identified for either the product from the LDHA or LDHB gene is represented in the plot by a circle and was labelled with the corresponding TMT labels shown on the x-axis: 126/127: carrier-treated samples; 128/129: rWNT5A-treated samples and 130/131: rWNT5A- and Box5-treated samples. Left panel: normalized intensity of peptide spreads from the LDHA gene product. Right panel: normalized intensity of peptide spreads from the LDHB gene product. The horizontal lines represent the mean values of the peptide spreads. (D) Left panel: LDH protein levels were measured by immunoblotting in rWNT5A-treated A2058 cells, compared to carrier treated (12h). Right panel: a representative of five independent experiments is shown, with relative densitometry. (E) LDH activity in lysates from A2058 cells treated as described for D. N = 3. *P < 0.05; ***P < 0.001.

