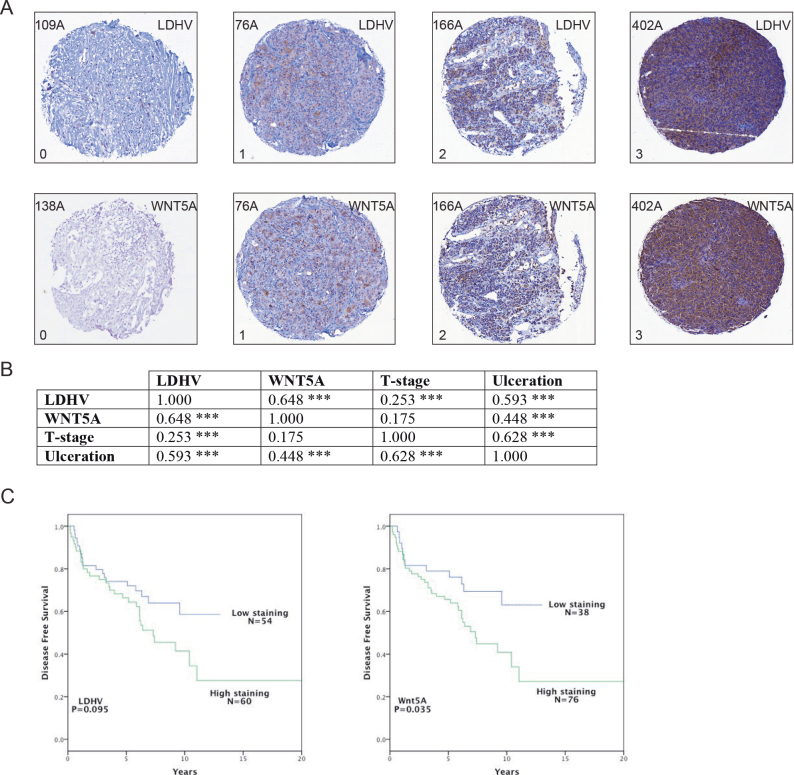
Fig. 4.
There is a positive association between LDHV and WNT5A expression in melanoma. (A) Example LDHV and WNT5A expression in a tissue array of melanoma patient tumour samples. Five example patient tumours are shown: 109A, 138A, 76A, 166A and 402A, where each tumour core is ~600 µm across; 0 and 1 indicate no to low expression, respectively, whereas 2 and 3 indicate moderate to high expression, respectively. (B) Correlations of WNT5A and LDHV expression in patient tissues (n = 114), and matched against the prognostic markers: tumour ulceration and T-stage. Correlations determined by Spearman’s Rho and cognate P value are shown. (C) Kaplan–Meier survival curves depicting disease-free survival versus the LDHV (left panel) or WNT5A (right panel) intensity of staining in the tumour cells. The intensity of staining was defined as outlined in A. *P < 0.05; **P < 0.01; ***P < 0.001.

