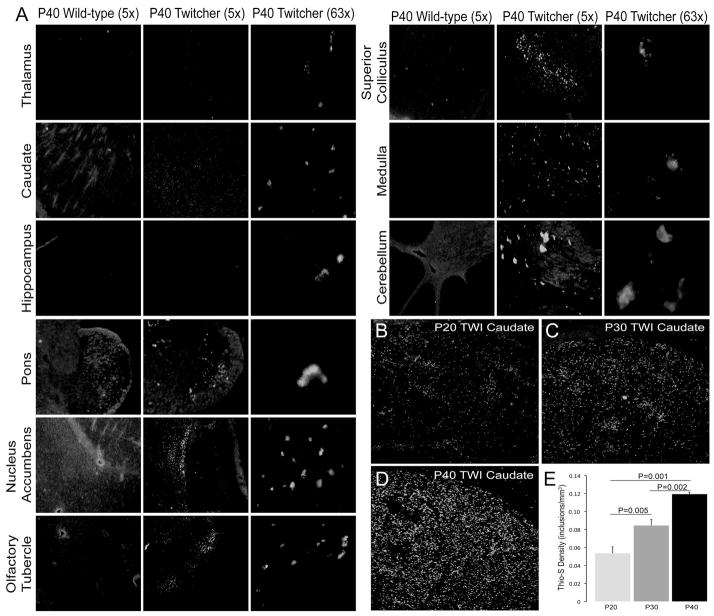
Figure 2. Regional distribution of thioflavin-S deposits and stereological quantification of thioflavin-S reactive deposits during postnatal development of the Twitcher caudate putamen.
A) Magnified (5× and 63×) images of thioflavin-S reactive inclusions in multiple anatomical regions of the P40 Twitcher (TWI) and P40 wild type (WT) brain regions. B–D) Confocal microscopy shows increasing abundance of thioflavin-S reactive inclusions in the Twitcher caudate putamen at 20 (B), 30 (C) and 40 (D) days of age. E) Stereological quantification of the density of thioflavin-S (thio-S) deposits (inclusions/mm3) shows significant (ANOVA) increases in inclusion density at each time point. Data is expressed as the mean +/− SEM of 3 mice per time point.

