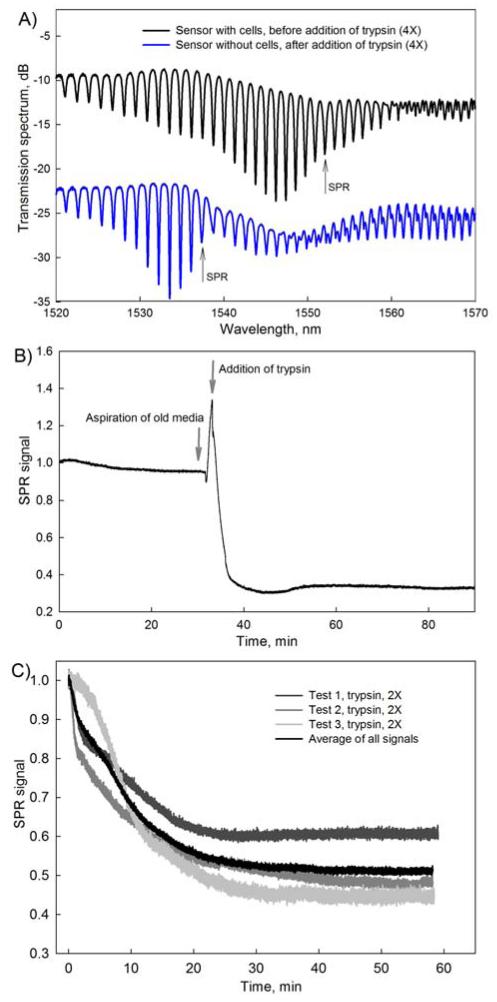
Fig. 2.
Typical SPR curves obtained with the fiber sensor. (A) SPR-TFBG transmission spectra. The black spectrum is obtained for a sensor with NIH-3T3 cells on its surface. The blue spectrum is from the same sensor after the cells were detached using trypsin (4×). Quantitative information is extracted by measuring the amplitude change of the most sensitive resonance indicated by an arrow; (B) Change in the amplitude of the most sensitive SPR resonance following the addition of trypsin (4×); (C) Reproducibility of experiments with trypsin at 2× concentration. The black curve is the average of the all SPR signals with a confidence interval of σ=0.578.

