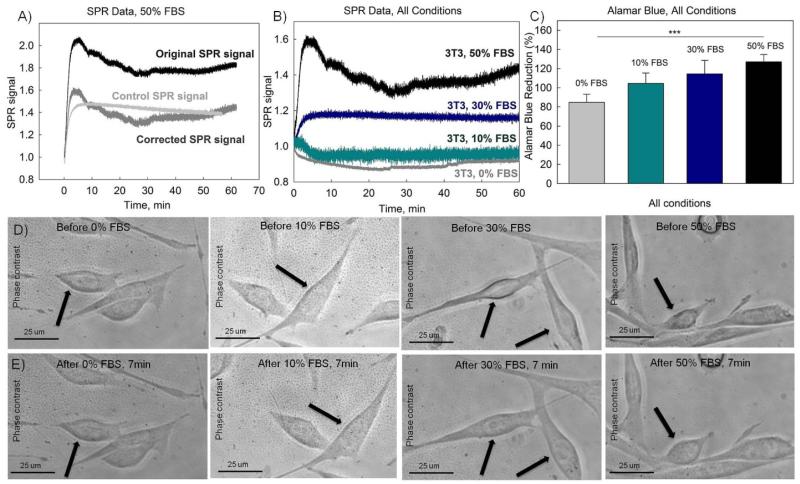
Fig. 4.
The addition of serum and its uptake by cells monitored in real-time with SPR fiber sensors confirmed with alamar blue assay and phase contrast imaging. (A) SPR responses during exposure to 50% (v/v) FBS solution. The black curve is the original SPR signal obtained in the presence of cells, the grey curve is a control SPR signal obtained in the absence of cells. The dark grey curve is the corrected SPR signal found as a difference between the original SPR and the control SPR signals. (B) Corrected SPR responses during exposure to different serum solutions (10%, 30% and 50% (v/v)) versus response to medium without FBS. (C) Alamar blue assay results for cells exposed to different concentrations of FBS; (D-E) Phase contrast images of the NIH-3T3 cells exposed to FBS solutions (50% FBS, 30% FBS, 10%FBS and 0%FBS). (D) Images were taken before the addition of FBS. (E) Images were taken 7 minutes after the addition of FBS.

