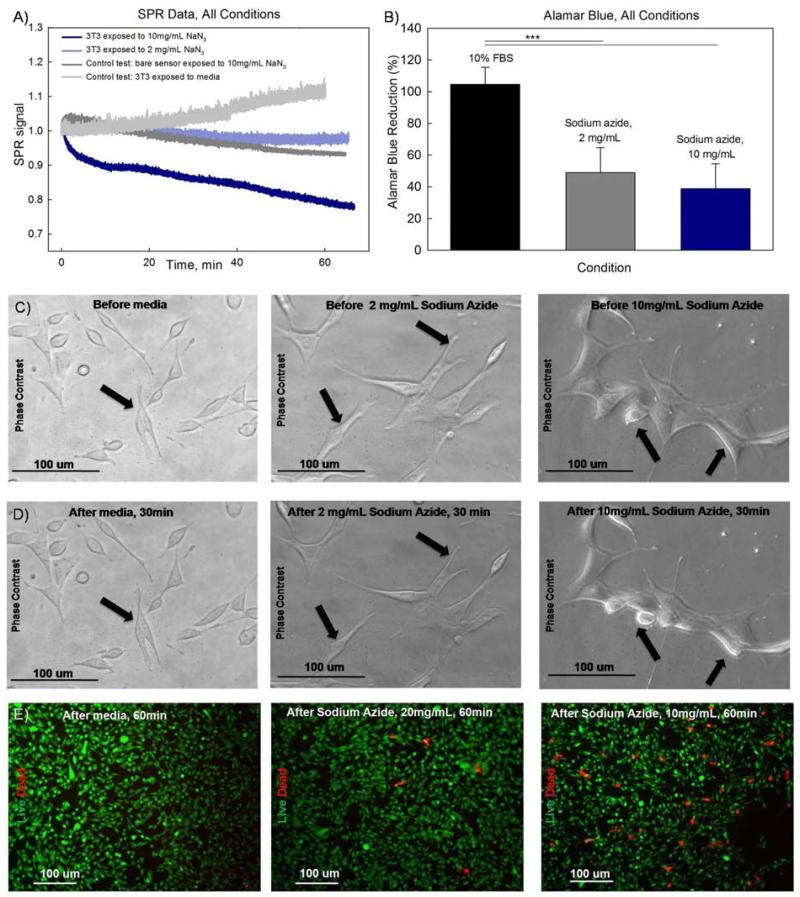
Fig. 5.
Real-time SPR response during cellular exposure to sodium azide complemented with alamar blue assay results and imaging confirming the effect of the toxin on cellular mortphology and viability. (A) SPR responses during cellular exposure to sodium azide (10 mg/ml, 2 mg/ml) and medium versus SPR control response to sodium azide (10mg/ml) in the absence of cells. (B) Alamar blue assay results for the applied concentrations of sodium azide. (C-D) Phase contrast images of NIH-3T3 cells exposed to sodium azide (10mg/ml and 2mg/ml) and standard medium. (C) Images of cells right before addition of sodium azide. (D) Images of the same cells 30 minutes after addition of sodium azide. (E) Live/dead staining of NIH-3T3 cells exposed to sodium azide (10mg/ml, 2mg/ml) and standard medium for one hour.

